
Stop Diversifying Your Picks. Start Diversifying Your Teams.
As the best ball community continues to advance in its understanding of strategy, portfolio diversification is garnering more attention. However, the best way to implement a properly diversified portfolio is still being debated. Some drafters in the discourse prefer concentrating their bets; when correct on a player take, they want to maximize the upside. This is a strategy we've seen a number of large field best ball tournament winners employ. Other best ballers advocate for taking a more balanced approach, using flatter exposures to mitigate some of their risk.
The understanding of risk management in best ball is still in its infancy, and I believe it is largely flawed. Most discourse surrounding diversification is geared specifically toward the exposure percentage of individual players.
In best ball we don't win tournaments just because we had the largest bags of the the best picks; we win because we had a team that put it all together and had the necessary good fortune in Week 17.
Don't hear what I'm not saying—you can have some overweight positions in your portfolio. You don't need to be perfectly balanced at 8.33% on every single player. However, many drafters aren't cognizant of how they diversify on a team-by-team basis, repeating huge chunks of their "core stands" on teams until their entire portfolio isn't much more than one very specific parlay ("Please god let Gabe Davis+Christian Watson+Bijan Robinson+Dalton Kincaid all hit otherwise I'm dust").
When we've identified an edge, we want to push it. But the key is to strike a balance between taking stands and remaining diversified from a portfolio standpoint.
Unnecessary Risk
Here's what highly undiversified drafters are missing: they're often exposing themselves to risk that doesn't provide any additional reward (or much less reward proportionate to their risk).
In other words, there is a point of diminishing returns, where adding another extremely similar team to the rest of your portfolio doesn't help your upside much, even though you're piling on more risk to your portfolio.
If you're having trouble following why that is, think of this problem through the lens of a DFS tournament where you're playing multiple copies of the exact same lineup. If you play two identical lineups and you happen to win, you've won not only the first-place prize but also the second. For illustration purposes, let's assume the following prize structure:
- $100,000
- $30,000
- $10,000
- $5,000
- $4,000
- $3,000
- $2,000
- $1,000
- $750
- $500
In our hypothetical tournament, we'll assume a field of 4,000 people and a $100 entry fee. If we submit a lineup with a field-neutral win rate (1/4,000), then we've got a 0.025% chance of winning $100,000 while risking $100.
If we play two identical lineups, we have the same probability of winning, but now we would win $130,000 while risking $200. If we played 10 identical lineups, now we're risking $1,000 with a 0.025% chance of winning $156,250. We can see that our risk/return relationship is getting worse for us the more copies of our own lineup we play.
When we win with our 10 identical lineups, we win ALL the money. But when we lose, we're much more likely to lose a lot more than if we played a well-diversified portfolio of lineups.
In best ball, we're very unlikely to wind up with a fully duplicated starting lineup, let alone an entire 18-player roster. However, the previous thought experiment can help us understand what happens as we condense our bets and what happens when we condense them to the absolute extreme.
Jaccard Similarity
I decided to analyze the level of diversification for every user that max entered BBM4 (150 teams). To measure the diversification in each portfolio, I used Jaccard similarity.
Jaccard similarity is a statistic used to measure the similarity between sets; in our use case, how many players were shared between two teams.
For a portfolio of 150 teams, there are 11,175 two-team combinations to compare. The Jaccard similarity coefficient is the average of the similarity of all 11,175 combinations. The higher the value, the less diverse the portfolio.
My hypothesis going into this research project was that diversification reduces the variance in a user's advance rate. Drafters with poor diversification will be more likely to experience extreme outcomes in their advance rates. Drafters with good diversification will be less likely to experience extreme outcomes in their advance rates.
For reference, the average advance rate for a 150 maxer in BBM4 was 17.97% or about 107% of the neutral advance rate of 16.7%. In other words – as you would assume – drafters maxing out BBM were generally better than average at advancing teams. So, we'll be defining extreme advance rate outcomes against the range of 150 maxers rather than all drafters.
Extreme outcomes will be defined as less than the 20th percentile advance rate among 150 maxers (13.3%) or greater than the 80th percentile (23.3%).
I compared the subsets of the 100 least and 100 most diversified drafters to see if the less diversified drafters were rewarded for their big stances with an above-average rate of extremely positive outcomes. The results may shock you.
Of the 100 least diversified drafters, 50% had below a 20th-percentile advance rate, while only 10% had above an 80th-percentile advance rate. The average advance rate for the 100 least diversified drafters was 14.6%, or about 87.6% of neutral advance rate.
Of the 100 most diversified drafters, 15% of them had below a 20th percentile advance rate, while 13% of them had above an 80th percentile advance rate. The average advance rate for the 100 most diversified drafters was 18.7% or about 112% of the neutral advance rate. And the most diversified drafters' advance rate was 128% of the 100 least diversified drafters'.
The standard deviation of the advance rate for the 100 most diversified drafters was 0.039, while for the 100 least diversified drafters, it was 0.086. So, the hypothesis that diversification reduced advance rate variance was consistent with the data.
At least in the BBM4 sample, the 100 least diversified drafters seemed to be taking on a pretty substantial amount of additional risk without really gaining a proportional benefit from that excess risk.
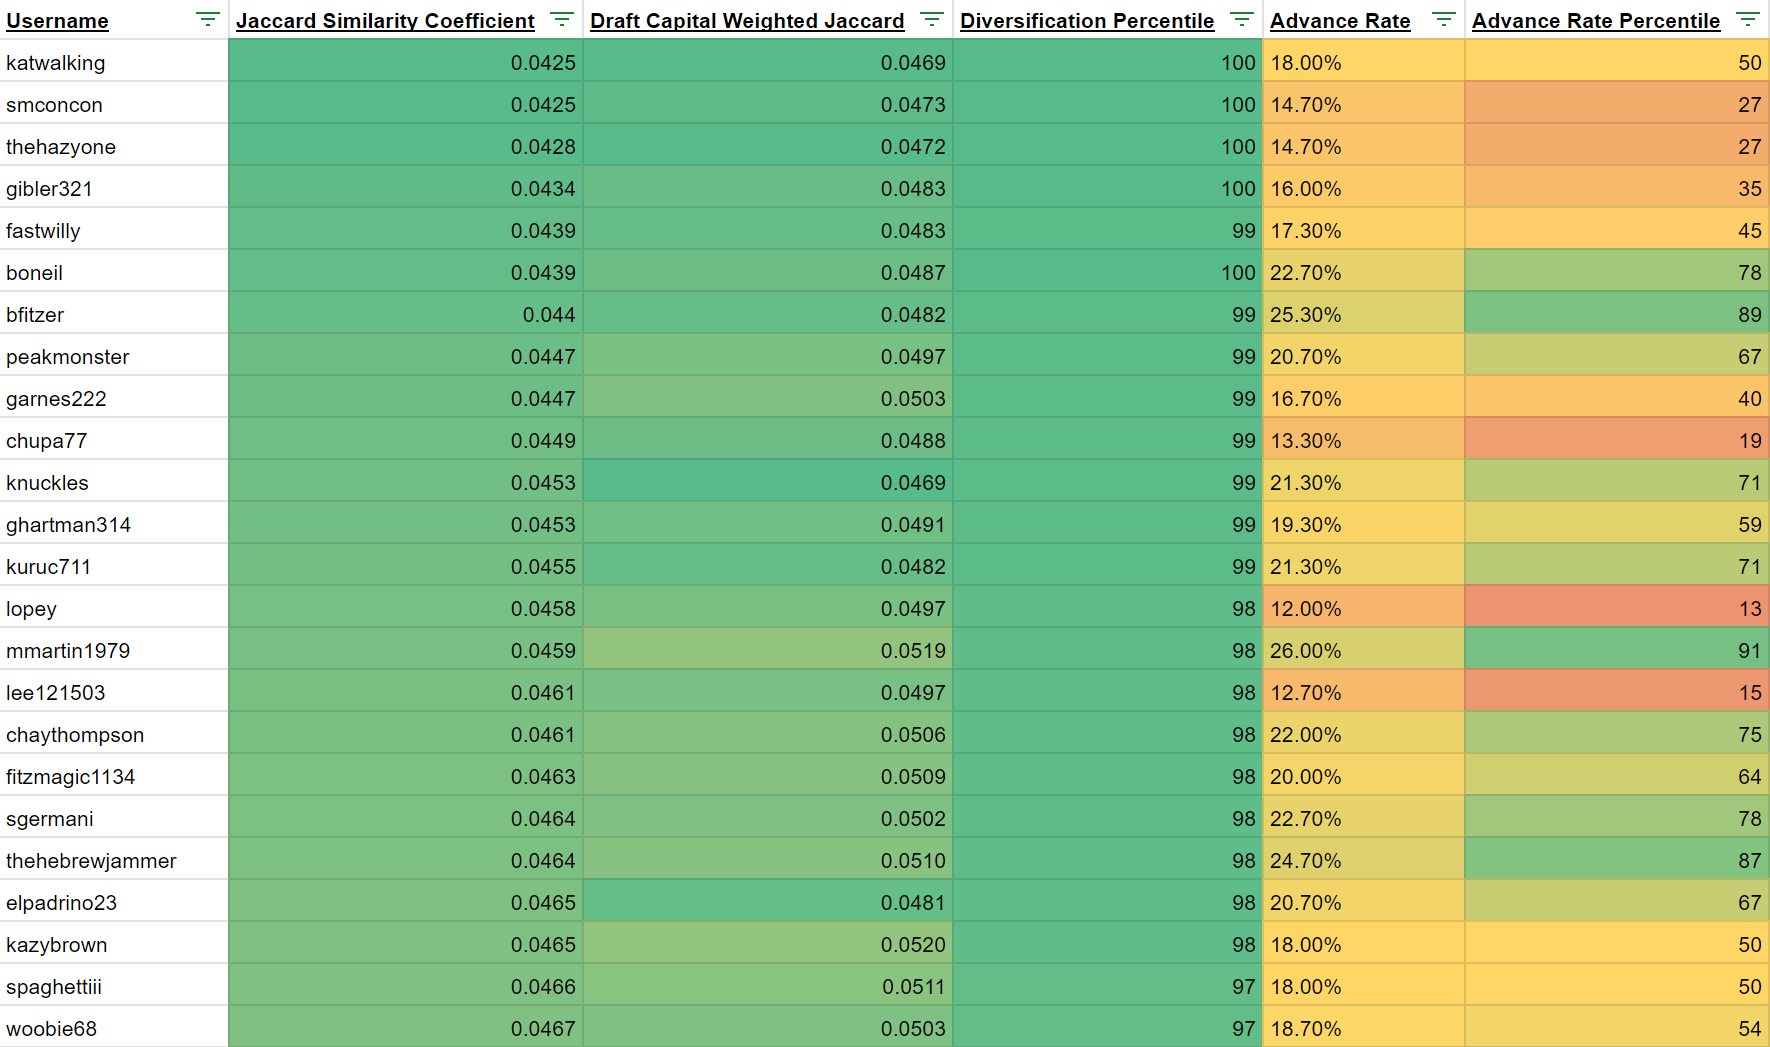
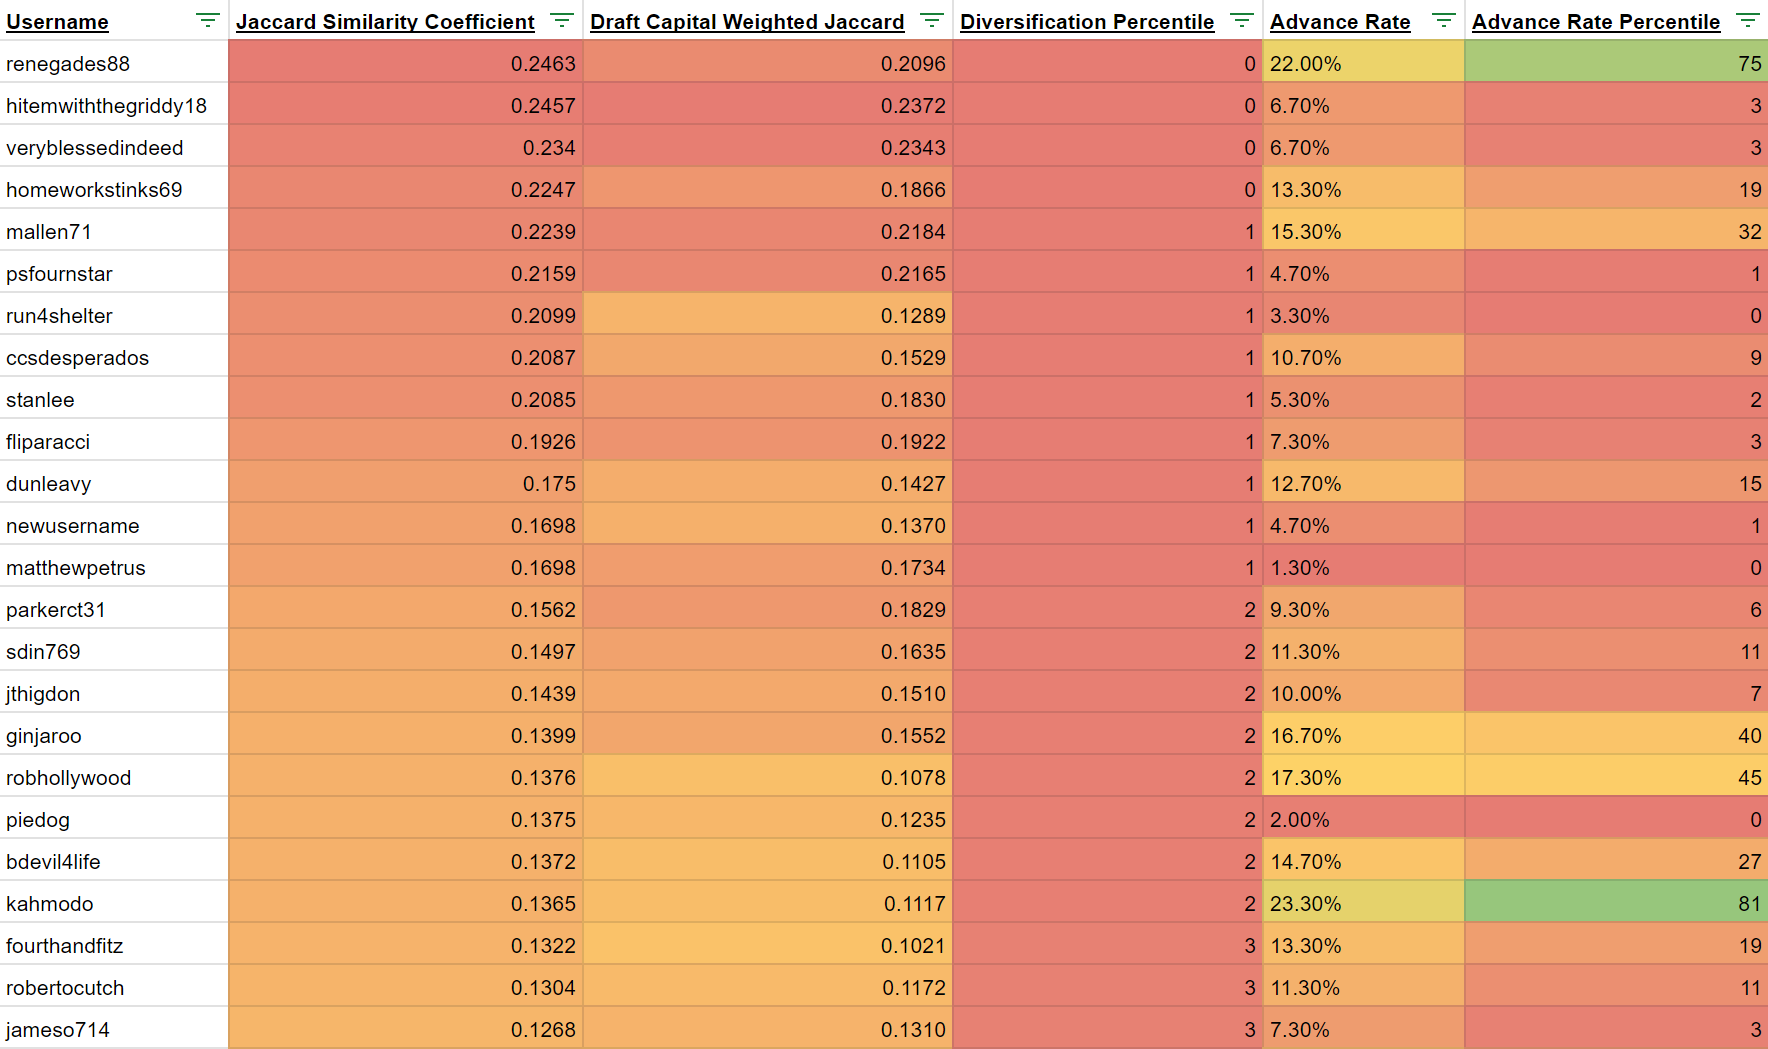
Below are snapshots of the 25 most diversified drafters and the 25 least diversified with their diversification statistics and advance rates for comparison:
But before I convert you to a diversified portfolio bro, let me show you what can happen when things go right for the undiversified portfolio drafters. Below are the top 25 150 max drafters by BBM4 advance rate:
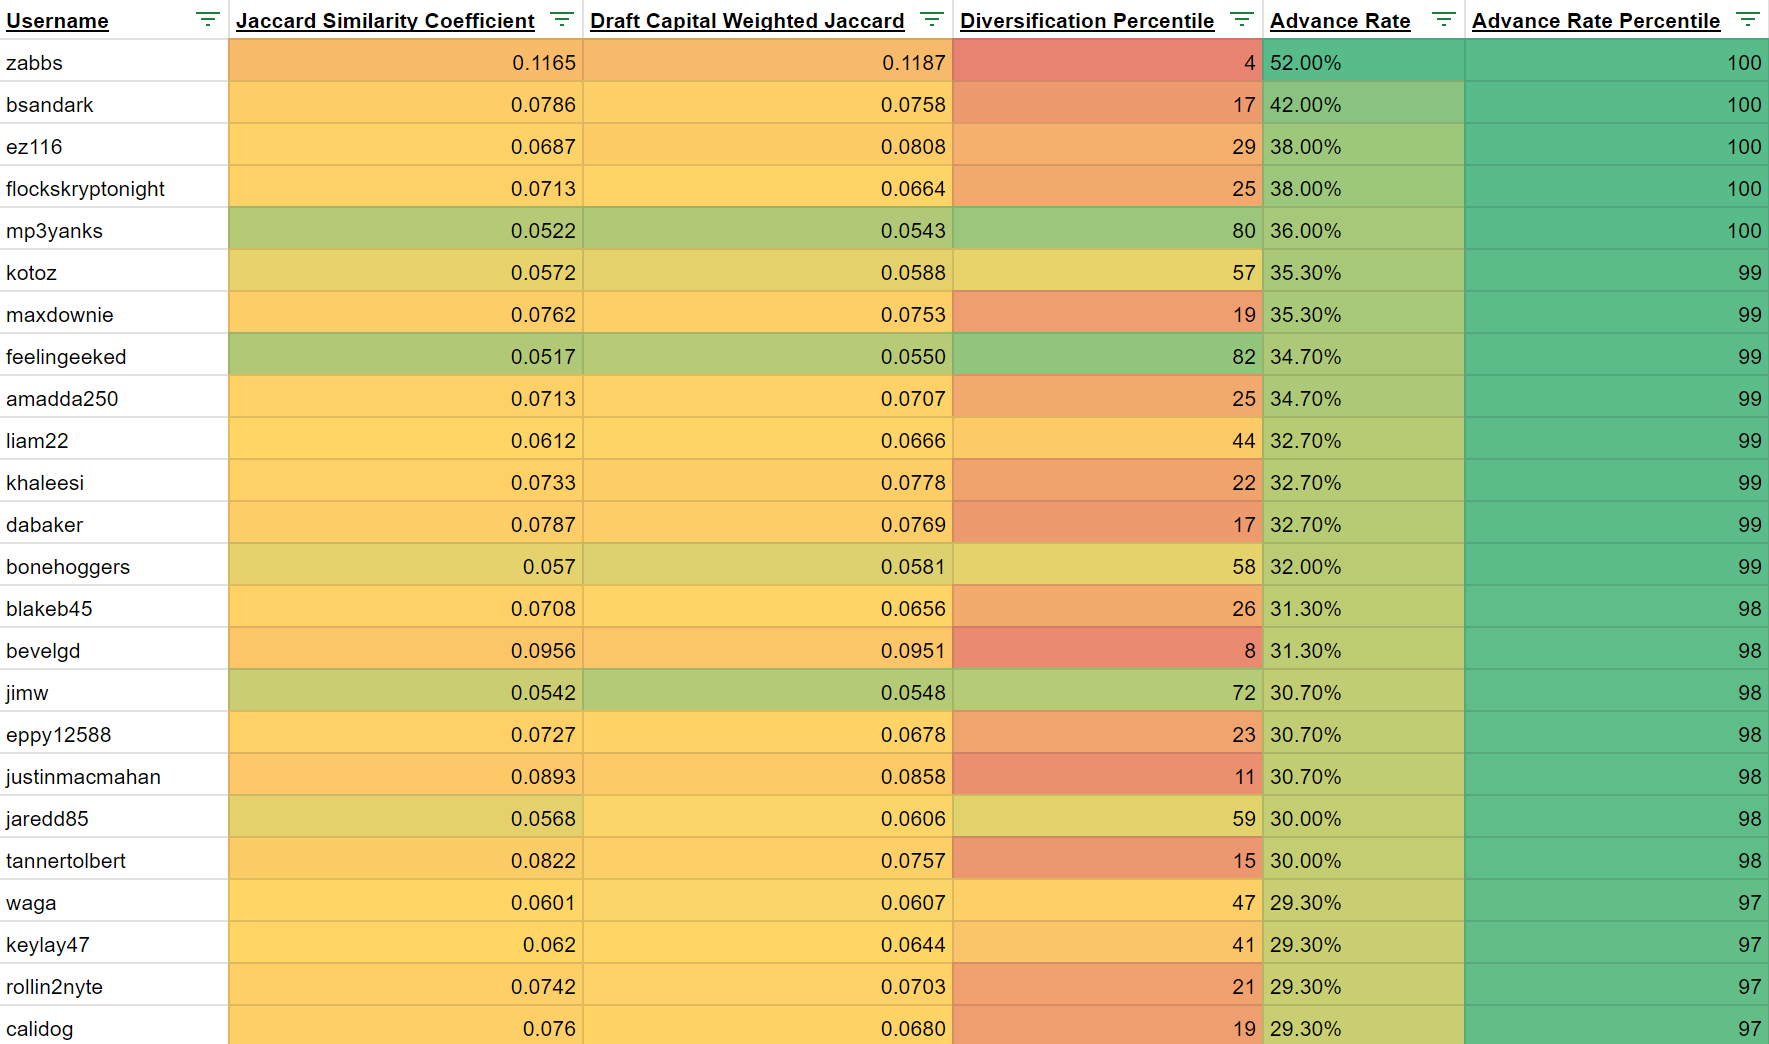
Clearly, you're clearly not doomed for failure if you don't diversify your portfolio. In fact, it's hard to imagine how someone could possibly advance 78 BBM teams without taking some serious stands.
But if you're not diversifying, you're much more likely to fail in any given season.
So much of fantasy football comes down to just a handful of players each season, so if you are diversified in your portfolio, it's likely you happened to have at least some of the season winning players.
There does seem to be a relationship between diversification and advance rate variance. Below is a plot of all 851 drafters with 150 BBM4 entries, where each data point represents a portfolio. The Y-axis is the deviation from the mean advance rate, that is, the absolute value of the difference between each drafter's advance rate and the base rate of 16.67%. The X-axis is the Jaccard Similarity coefficient, which we're using to measure diversification. Each data point has been color coded by advance rate percentile (green for >80th, red for <20th, yellow for everything in between).
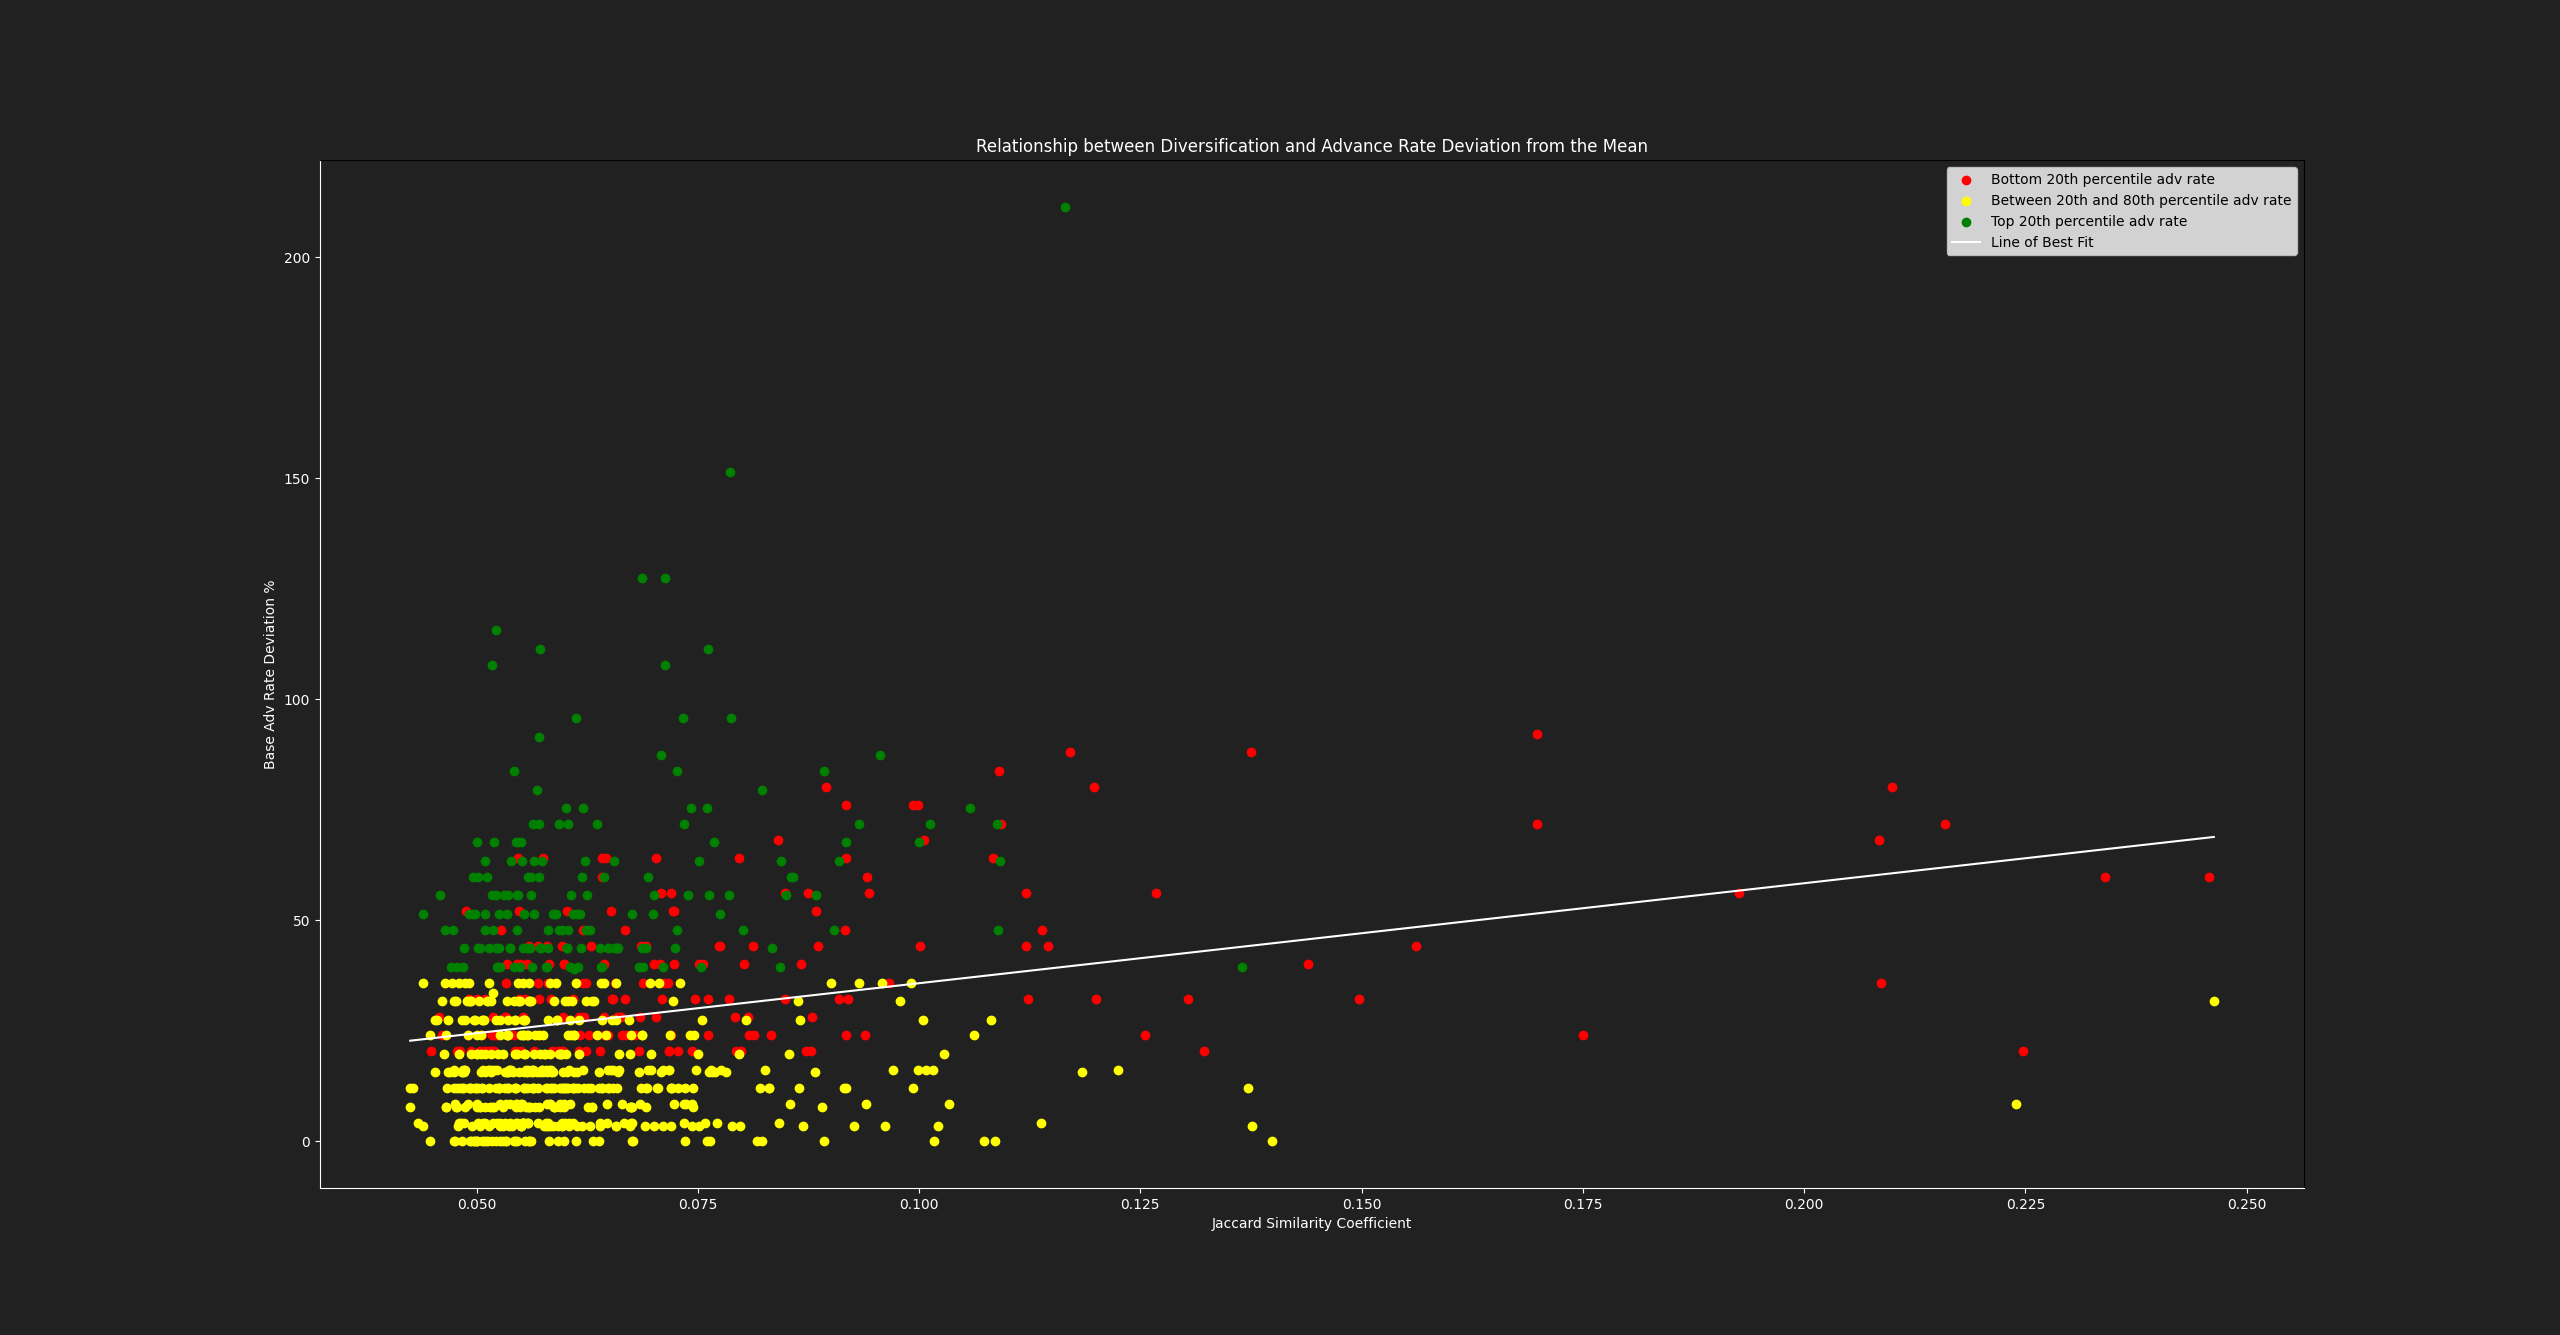
The chart above helps us visualize the relationship between diversification and advance rate deviation. Taking a big stand in your portfolio is fine, but past a certain point, you're just adding risk to it.
If your entire portfolio is what you would consider a small dollar amount, and you're perfectly fine losing 100% of it year after year, then by all means, draft whoever you want to draft. Take huge stands on tons of players; have fun with it. If you're getting down a significant amount of money across your best ball portfolio, though, some level of diversification is advisable. It will likely reduce your risk without forcing you to sacrifice much in the way of upside.
And remember, diversification in this context is not occasionally mixing in players you usually avoid. It's about avoiding the temptation to repeatedly hammer the same player combos draft after draft.
If you max entered BBM4 and want to see how well you diversified your portfolio, here is the CSV file with the Jaccard similarity data:
Full Newsletter Archive

Details on $50 Underdog Credit, 40% off Spike Week, Discord Access, Premium Podcast Feed

