A Dash of Diversification
In the article Stop Diversifying Your Picks. Start Diversifying Your Teams. I used Jaccard similarity to explore best ball portfolio diversification. If you haven't read that article already, you're going to want to do that before reading this one, as there will be some concepts that I'm building on from the first article.
If you like extended metaphors, Pat Kerrane recently published The Tree of Jaccard, which expanded on the concepts I introduced in the first article of this series on diversification.
Previously, I discussed the relationship between diversification and advance rate variance. The findings were as expected; there is an inverse relationship between diversification and variance. The less diversified you are, the more variance you're taking on.
Reducing your variance without sacrificing your edge is easier said than done. So before we determine how exactly to diversify our teams, we should consider the implications of diversification.
If The World Forgot Football
Let's start with a hypothetical situation. Pretend that everyone in the world experiences severe collective amnesia except for you. Coincidentally, all football historical data, copies of game footage, and anything else that would be useful in pricing players for fantasy football have been lost.
Miraculously, someone was able to recover all of the historical data, but unbeknownst to them and the rest of the fantasy football community, there is an error in the data that lists Josh Allen as the backup QB for the Bills, and Mitch Trubisky has been incorrectly attributed all of Josh Allen's career stats.
The fantasy football community begins drafting Mitch Trubisky in the 3rd round, and Josh Allen goes entirely undrafted. Since you are the only person who actually has a memory of the truth, you – and you alone – know that Josh Allen and Mitch Trubisky are both tremendously mispriced.
What percentage of your teams would you draft Mitch Trubisky on?
What percentage of your teams would you draft Josh Allen on?
Bills Mafia
The answer to these questions is pretty simple: you'd take 0% Mitch Trubisky and 100% Josh Allen. These are substantial mistakes by the market that you have a very high degree of confidence in.
But just because you would have 100% of Josh Allen does not mean your portfolio couldn't still be diversified. What matters is how you construct the rest of your team around Josh Allen.
In real life, we often won't have this degree of confidence in our stances, nor will we find a market inefficiency this large very often, if ever (Puka and Kyren won't happen every year, despite every Twitter analyst claiming they've found this year's Puka).
But the market does get plenty wrong each year, and that's a crucial aspect of playing fantasy football. We will identify spots where we disagree with the market, then it's up to us to estimate how likely it is that we're correct and accept the appropriate amount of risk on a given player.
So, if you're looking for the magic threshold you should target for your Jaccard similarity coefficient in order to be properly diversified, the answer is "it depends."
It depends on how many players you have priced differently than the market, how many of those players come from each position, what their ADP is, and a number of other factors.
So rather than searching for a magic number we should target for our Jaccard similarity, a better approach would be to understand where and why our bets are concentrated and diversified and if they align with our intentions.
Diversification Breakdown
To help increase our ability to measure and understand portfolio-level diversification, I've expanded on how to apply Jaccard similarity by calculating the values for a couple of different subsets:
- RB Similarity
- WR Similarity
- TE Similarity
- QB Similarity
- First 6 Picks Similarity
We can use these metrics to take a more granular look at our diversification within position groups, as well as the six highest draft capital picks across our portfolios.
Below, we'll take a look at a drafter you might recognize and see how we can utilize some of these portfolio statistics to improve our drafting.
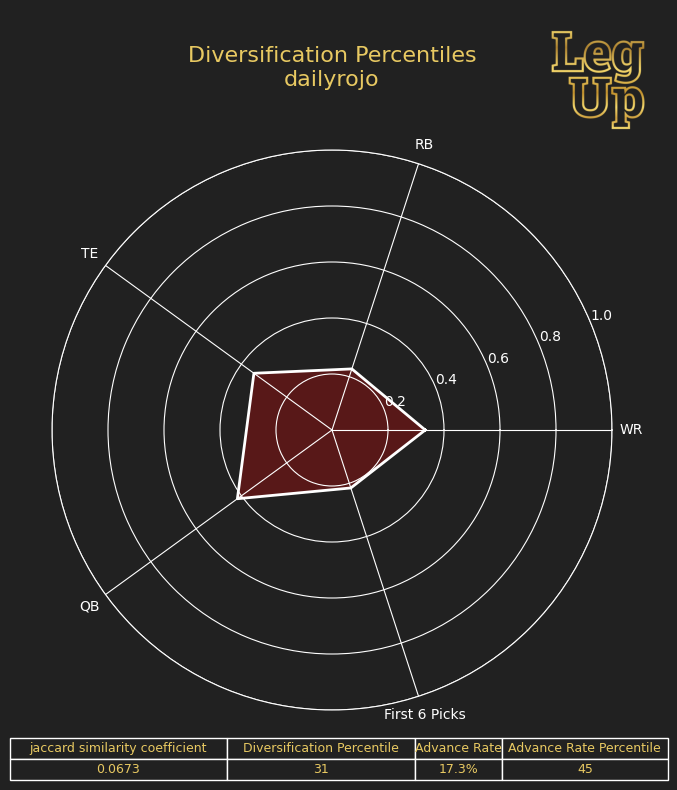
Above, we have Pat's BBM4 diversification percentiles, a contest in which he took an exploitative approach with 11 players over 20% exposure and two players over 30% exposure (if you've been drafting off our ranks this season, you won't be at all surprised to find out one of those players was Jaylen Warren at 34%, the other was Pat's biggest stand for last season: Breece Hall at 37.3%).
We can see that Pat's least diversified position group was RB, which tracks given that his two highest-exposure players were both RBs. Pat was also relatively concentrated with his first six picks of each draft, coming in just above the 20th percentile among all 150 max drafters.
Why was Pat so concentrated among his first six picks of each draft? For starters, he had a decent amount of early fades (I'm defining a fade as below 6% for any individual player):
- Austin Ekeler - 5.33%
- Travis Kelce - 5.33%
- Nick Chubb - 1.33%
- Stefon Diggs - 5.33%
- Saquon Barkley - 0.67%
- Derrick Henry - 4%
- Calvin Ridley - 5.33%
- Patrick Mahomes - 2.67%
- Josh Allen - 4.67%
- Tee Higgins - 5.33%
- DK Metcalf - 0.67%
- Amari Cooper - 3.33%
- Rhamondre Stevenson - 5.33%
- Joe Mixon - 2%
- Justin Fields - 4%
- Christian Watson - 2%
- Najee Harris - 0%
- Joe Burrow - 4.67%
- Aaron Jones - 2%
- Kenneth Walker - 3.33%
- TJ Hockenson - 2.67%
- Darren Waller - 5.33%
- Dameon Pierce - 2%
- Christian Kirk - 4.67%
- George Pickens - 5.33%
- Alexander Mattison - 2%
- Trevor Lawrence - 4%
- Jerry Jeudy - 4.67%
- Miles Sanders - 1.33%
Among those 29 players, Pat had a sum 99.33% exposure, which is significantly less than the market-neutral sum exposure of 241.67%. All those draft picks Pat spent not selecting the above 29 players had to go somewhere (a lot of it went to Breece Hall), which led to his relatively high concentration among his first six picks.
Pat also had a few large stands (more than double the field) on players that were going in the first six rounds of the draft:
- Breece Hall - 37.33%
- Jaxon Smith-Njigba - 25.33%
- JK Dobbins - 20%
- Mark Andrews - 20%
- Brandon Aiyuk - 17.33%
- Drake London - 17.33%
- Jaylen Waddle - 16.67%
Just these seven players accounted for a sum 154% exposure, or nearly triple field neutral exposure.
I asked Pat if his exposures appropriately matched his intent with each of the players he had faded or gone overweight on in the first six picks. This was a topic I had heard Pat discuss in the past, which he framed as "if I had to choose between these two players, I'd probably say that I preferred one over the other at a ratio of 55:45, but I actually ended up with 80:20 when I looked at my exposures." So I wanted to see if he felt like this was something he had improved at over the years.
Here's what Pat had to say:
"I felt like I did a better job last year than I had in the past. But I still want to make more of an effort to admit when a tie is a tie between players. I feel really good about the big stands I made last year, but not as good about the medium stands."
So it turns out this diversification thing might be trickier than we think. Even if we're making an effort to be appropriately diversified, it can be difficult even for some of the best drafters. As humans it's difficult for us to make what we believe is the second best choice, which is often what we're being asked to do when diversifying our teams. The newest member of the LegUp team, ShaidyAdvice, summed it up beautifully in our recent podcast about why it can be tough for drafters to deviate from what they believe to be the best choice for the sake of diversification—"it doesn't feel good to order your second favorite ice cream flavor on purpose."
The Sprint is the Quintessential Diversification Tournament
Recently, Underdog released "The Sprint", a format that FFPC Main Event drafters will be familiar with. In this tournament, 2/12 teams advance from the Weeks 1-14 regular season, with the 3,700 advancing teams entering a playoff sprint. The Sprint is cumulative scoring for Weeks 15-17.