It's Only Week 3 - An Extremely Brief Analysis of Early Season Advance Rate
I currently have a 10.7% advance rate, but unlike many other drafters in the best ball space, I'm not freaking out (ok maybe just a little bit).
The majority of my teams were zero or hero RB teams, where I leaned into the concept of antifragility (here's a fantastic book on the topic Antifragile: Things That Gain from Disorder).
So it's natural to expect that a strategy benefitting from uncertainty and chaos might just need a little more time for the chaos to occur, right?
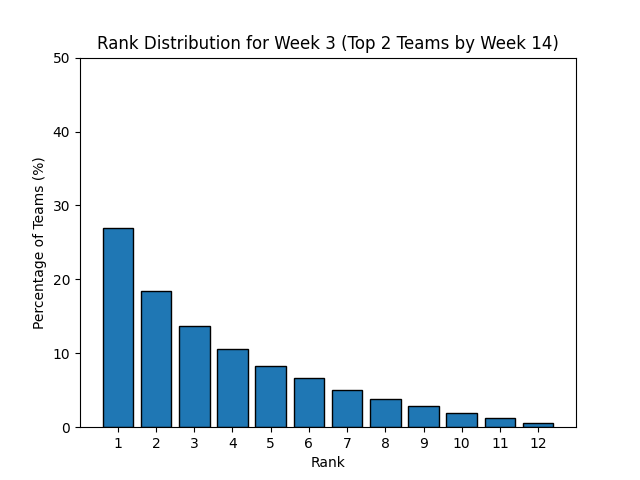
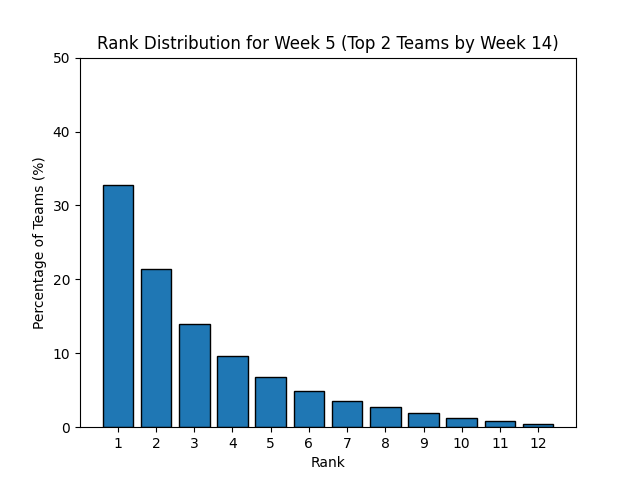
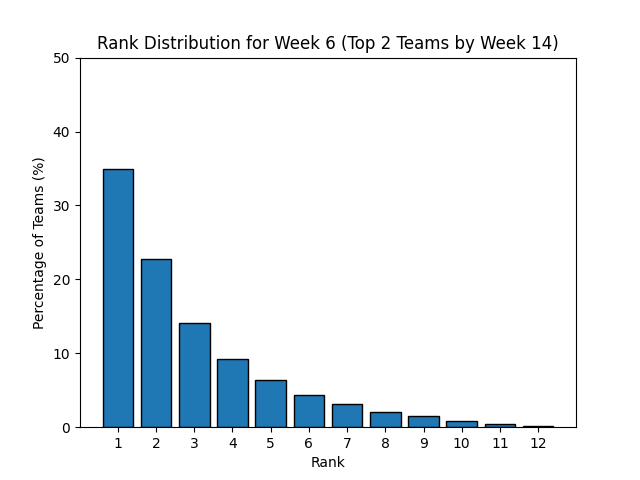
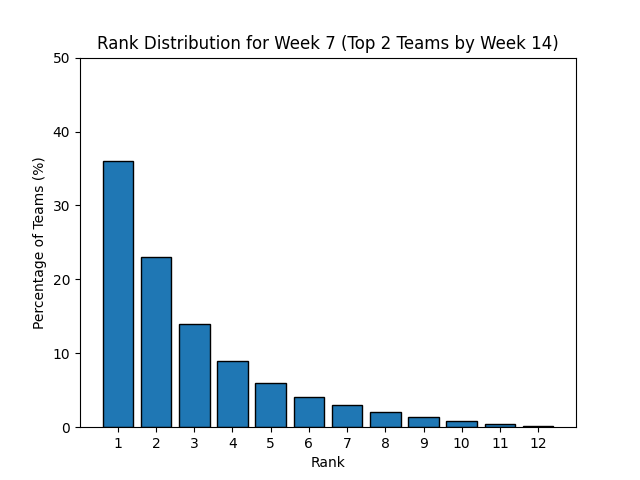
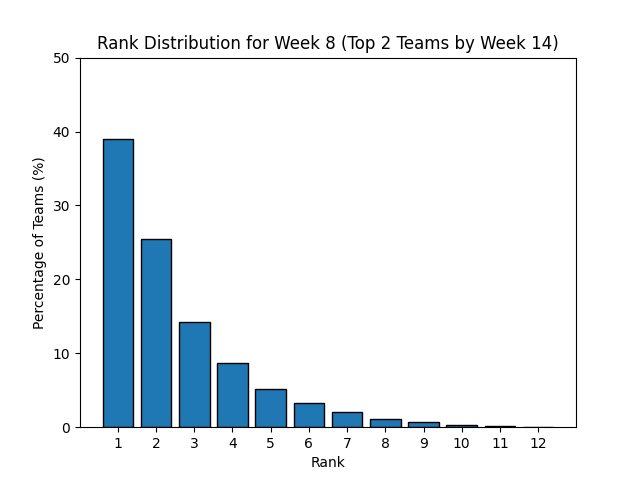
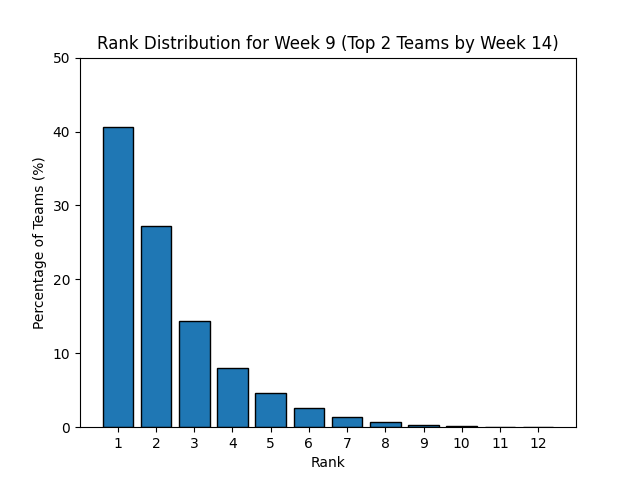
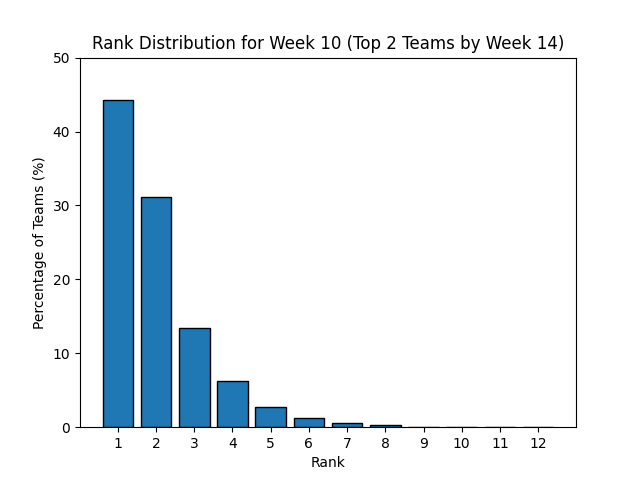
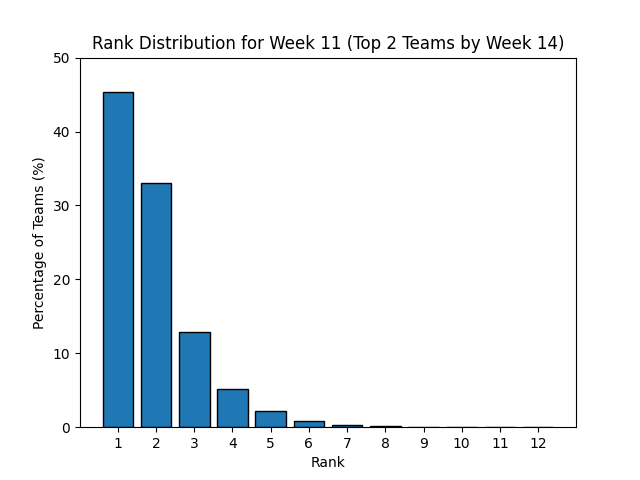
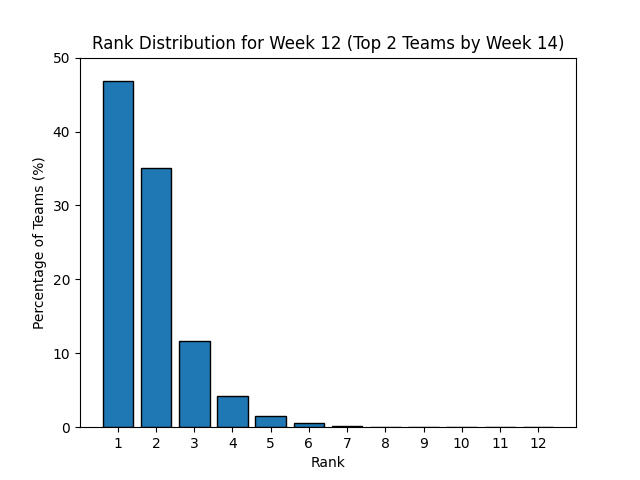
I went back, looked at BBM4 data, and calculated the rate at which teams that were advancing in any given week actually advanced after week 14. The results are a little jarring:
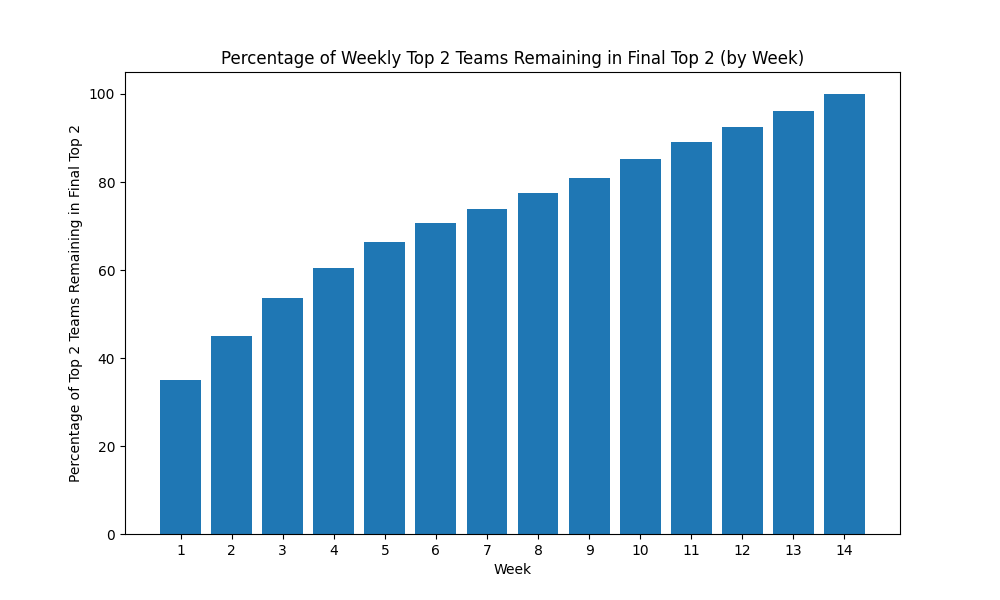
In BBM4, approximately 50% of teams that were advancing in week three were still advancing at the end of the season. That was much higher than I would have guessed, but it may have something to do with the fact that Puka Nacua and Kyren Williams came out of the gate so strongly that they lead to teams that were absolutely dominant the entire season.
Regardless of the noise of just one season, it's not unreasonable to assume that there's a decent amount of signal to teams that are currently advancing.
We can make some rough estimates to infer what the rest of the season might have in store for us.
We'll use my current 10.7% advance rate in our example. Let's assume 50% of teams that are currently advancing will ultimately advance.
That means of my 10.7% advancing, I can expect 50% of those teams to hang on and advance, which would give me 8 advancing teams, or 5.33%.
For my remaining 134 teams that currently aren't advancing, we can update our base case advance rate of 16.67% to a more informed estimate. If we apply the same assumption, that 50% of currently advancing teams will ultimately advance, that means for teams that aren't advancing there is effectively only one spot remaining up for grabs to advance (50% of two is one). So if we assume that my non-advancing teams are evenly distributed across each placement, and average out to the average advance rate, then we can expect 1/12th of those teams to ultimately advance.
That gives us an expected 11.17 advancing teams out of the cohort of non-advancing teams currently.
If we sum that with the advancing teams that we expect to hold on, we get roughly 19 advancing teams, or a 12.67% advance rate as my new expected advance rate given the current information.
So what can you do with this information to help your best ball teams? Absolutely nothing. But what you can do to help yourself is reset your expectations given this new information. If this season winds up being one where you have a below average advance rate, that's ok. Take the lessons away from it that you can and dust yourself off for another slate.
Best ball feels particularly brutal compared to daily or weekly fantasy formats because the slates take so long to play out. But consider where we are at in the tournament. We are three weeks into a 14 week regular season, which is just the first round of a four round behemoth of a tournament. If we consider each round to be 25% of the tournament, then we're about 21% of the way through 25% of the tournament, or roughly 5%.
If you were playing an NFL Showdown slate and the game was only 5% of the way through (a little over three minutes in to the first quarter) would you even be checking the leaderboard?
All this to say, no, my teams aren't alright (but they might be). I didn't intend for this to be a long post, but we'll certainly have some content coming out later in the season with some lessons that we learned this year. If you're looking for things that you can take away from this season to improve your process, remember that the specific outcome is not what you should be focusing on. You should be considering the entire range of outcomes, and the probability of all of the different outcomes in the range occurring. For example, does Jaylen Warren suffer from a pre-season injury in 100% of possible outcomes? Of course not! So what do all of the feasible outcomes look like, and what probability do you assign to each of them occurring? I know that can be a difficult concept to grasp, but it's an important one if you want to improve your process.
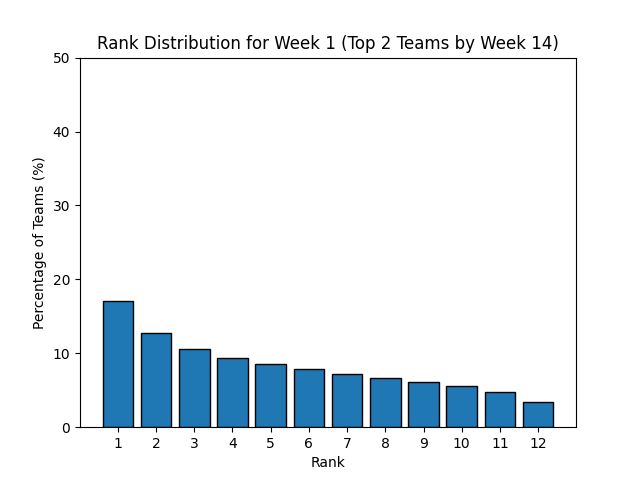
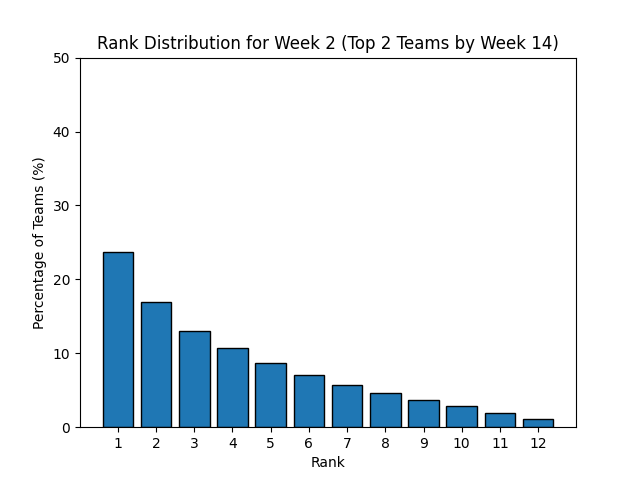
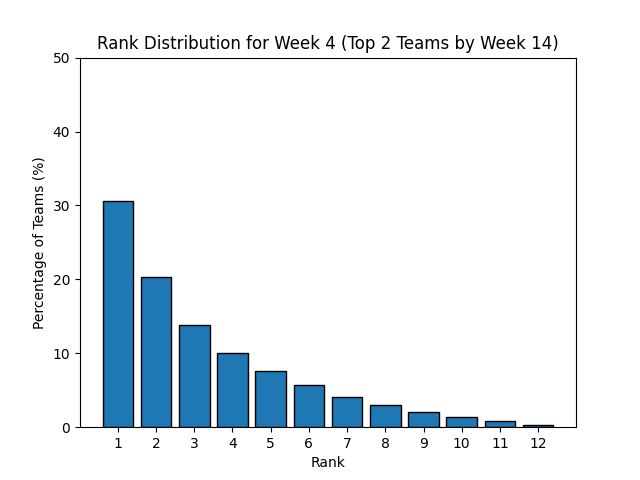
I'll leave you with one last morsel of data viz. Below are histograms for each week in BBM4, displaying the percentage of teams that went on to advance, given their current pod placement in that week. For example, in the first chart we can see that approximately 10% of teams that were in 3rd place after week one went on to advance.
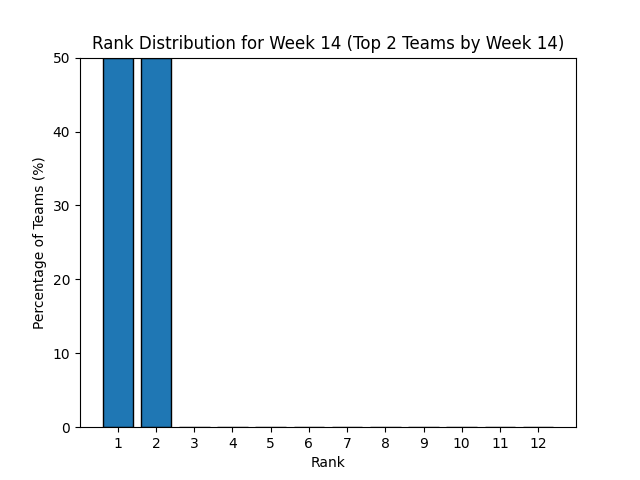
As you would expect, the further we get into the season, the more likely the higher scoring teams are to advance—culminating with the Week 14 chart, when the top two teams make up 100% of the advancing teams.
