Toying with Week 16 Correlation
With the flattening of the Week 17 prize structure in Best Ball Mania V, there has been plenty of discourse surrounding prioritizing game stacking in Week 16.
Neil Farley shared this Twitter thread demonstrating that if we were able to precisely control our win rate for a given week, Week 16, not Week 17, would be the priority.
Mike Leone has been hard at work updating his Best Ball Manifesto and recently shared some findings that led him to believe the field was currently undervaluing game stacking in weeks 15 and 16.
The thing is, we do not have a "do better" lever that allows us to modify our win rate for a specific week. We've got limited tools at our disposal. The tool that comes to mind for most people is game stacking.
How do we measure the value of stacking?
I wanted to quantify different types of correlation and what impacts they had on Week 16 win rate, Week 17 finish quantiles, and EV in each of those weeks.
In order to isolate the variables I wanted to observe, I needed a methodology that could generate a data set I could use for testing, as well as remove noise from unrelated variables.
With the help of ShaidyAdvice, I built a sim to generate weekly fantasy point data that I could use for this project. Then I constructed a toy game with the following parameters:
- Fantasy rosters with 3 total starting players:
- QB
- WR
- WR
- Six total "NFL Teams", each with:
- QB1
- WR1
- WR2
- One week of simulated games
- Team A vs. Team B
- Team C vs. Team D
- Team E vs. Team F
In this toy game, all QBs have identical distributions of fantasy points, as do all WRs. To simplify, think of every QB being a clone of Josh Allen, and every WR – WR1 and WR2s – being a clone of Tyreek Hill. Even though the labels may call them WR1 and WR2, they both have the exact same range of outcomes.
Using the same scoring distributions for every player within a position allows us to remove any noise that would be caused by having players with unique distributions. For example, if instead of a bunch of Hill clones, I used Hill clones for the WR1s and Jaylen Waddle clones for the WR2s. This make it hard to precisely measure how much of the change in win rates and EV came due to correlation versus Hill simply scoring more fantasy points than Waddle on average.
The rules for this toy game are the same as BBM5. Week 16's 1/16 advance structure and Week 17's prize structure.
I generated all possible combinations of fantasy teams that could be created given the six "NFL teams" and classified each roster based on the type of correlation it had:
- Double Stack (example: QB-A, WR-A1, WR-A2)
- Single Stack (example: QB-A, WR-A1, WR-C1)
- Single Stack w/ Bringback (example: QB-A, WR-A1, WR-B1)
- Naked QB w/ 2x Bringback (example: QB-A, WR-B1, WR-B2)
- Naked QB w/ Bringback (example: QB-A, WR-B1, WR-C1)
- WR Team Stack w/o QB (example: QB-A, WR-C1, WR-C2)
- WR Game Stack w/o QB (example: QB-A, WR-C1, WR-D1)
- No Correlation (example: QB-A, WR-C1, WR-E1)
I ran 10,000 simulations of a single week of these three games and used the "No Correlation" class as my baseline for setting scoring quantiles.
Before we dive into the results, here are some caveats on my methodology:
Stacking without the QB is Downplayed
Because there are only six total QBs, stacking without the QB is worse in this toy game than it would be in real life.
When both WRs from one of my fictitious teams are going off (say, team A), there are only five other QBs that have a chance to outscore QB-A. This makes it much easier for QB-A to be "the guy you need" than if he were competing against 31 other QBs.
Correlation may be Overstated
I used scoring distributions equivalent to what the projected QB1 and WR1 in a given week would have. This means we should be seeing approximately the maximum benefit that correlation can provide since we are using the highest-scoring distributions.
Correlation may be... Understated
When using covariance matrices that would be appropriate for a single week of DFS, we are underrepresenting a very valuable aspect of correlation in best ball: the correlation based on the game total of a specific game. In DFS, game totals are highly predictive and directly affect player projections for that slate because the lines are being set that week. This essentially bakes in some of the value that correlation provides. It's already accounted for in player projections, salaries, etc.
It still pays to find the games that go off in a given DFS week. But largely, in that version of fantasy, we're looking for spots where the market mispriced single-week upside on specific correlated options.
In best ball, we do not have anywhere close to an accurate line for Week 16 or Week 17 games. By building teams that function as bets on these games, we benefit not only from the same correlation we'll be hunting for in DFS in those same weeks. But also from the market inefficiency in the line setting for those games four months in advance.
In other words, even if Mike Evans and Diontae Johnson aren't highly correlated in a DFS context, both players benefit in a big way if the current 42.5 game total rises significantly ahead of December 29th.
Time for Some Charts
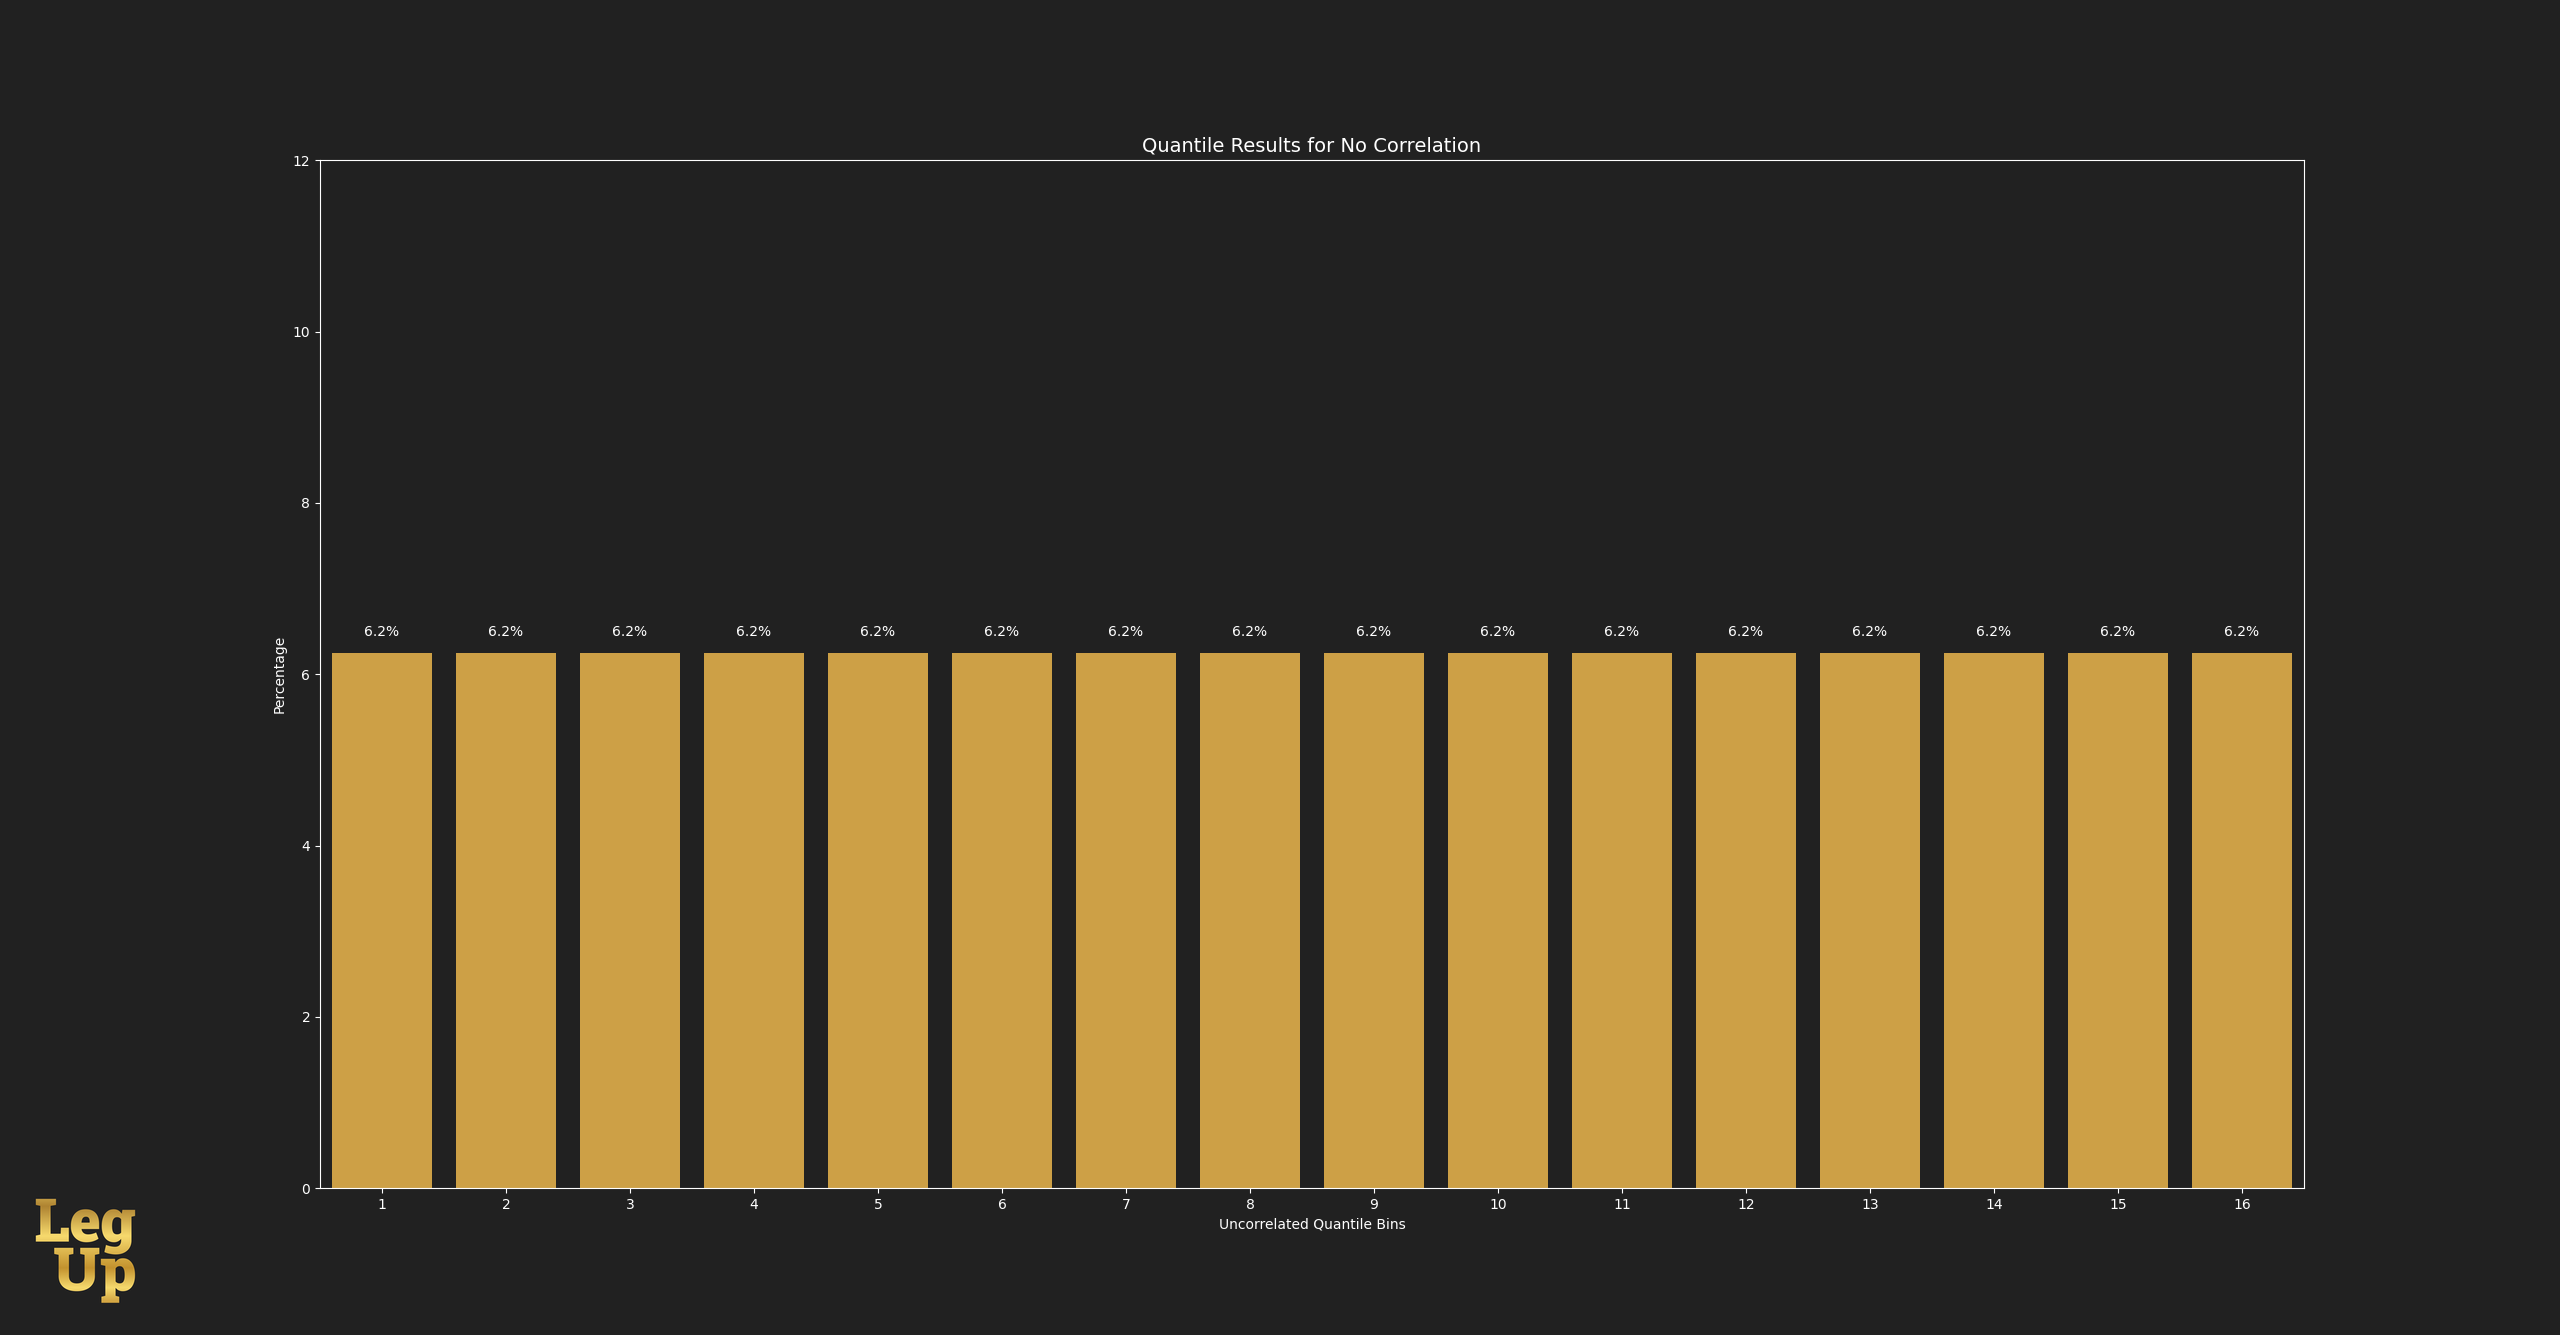
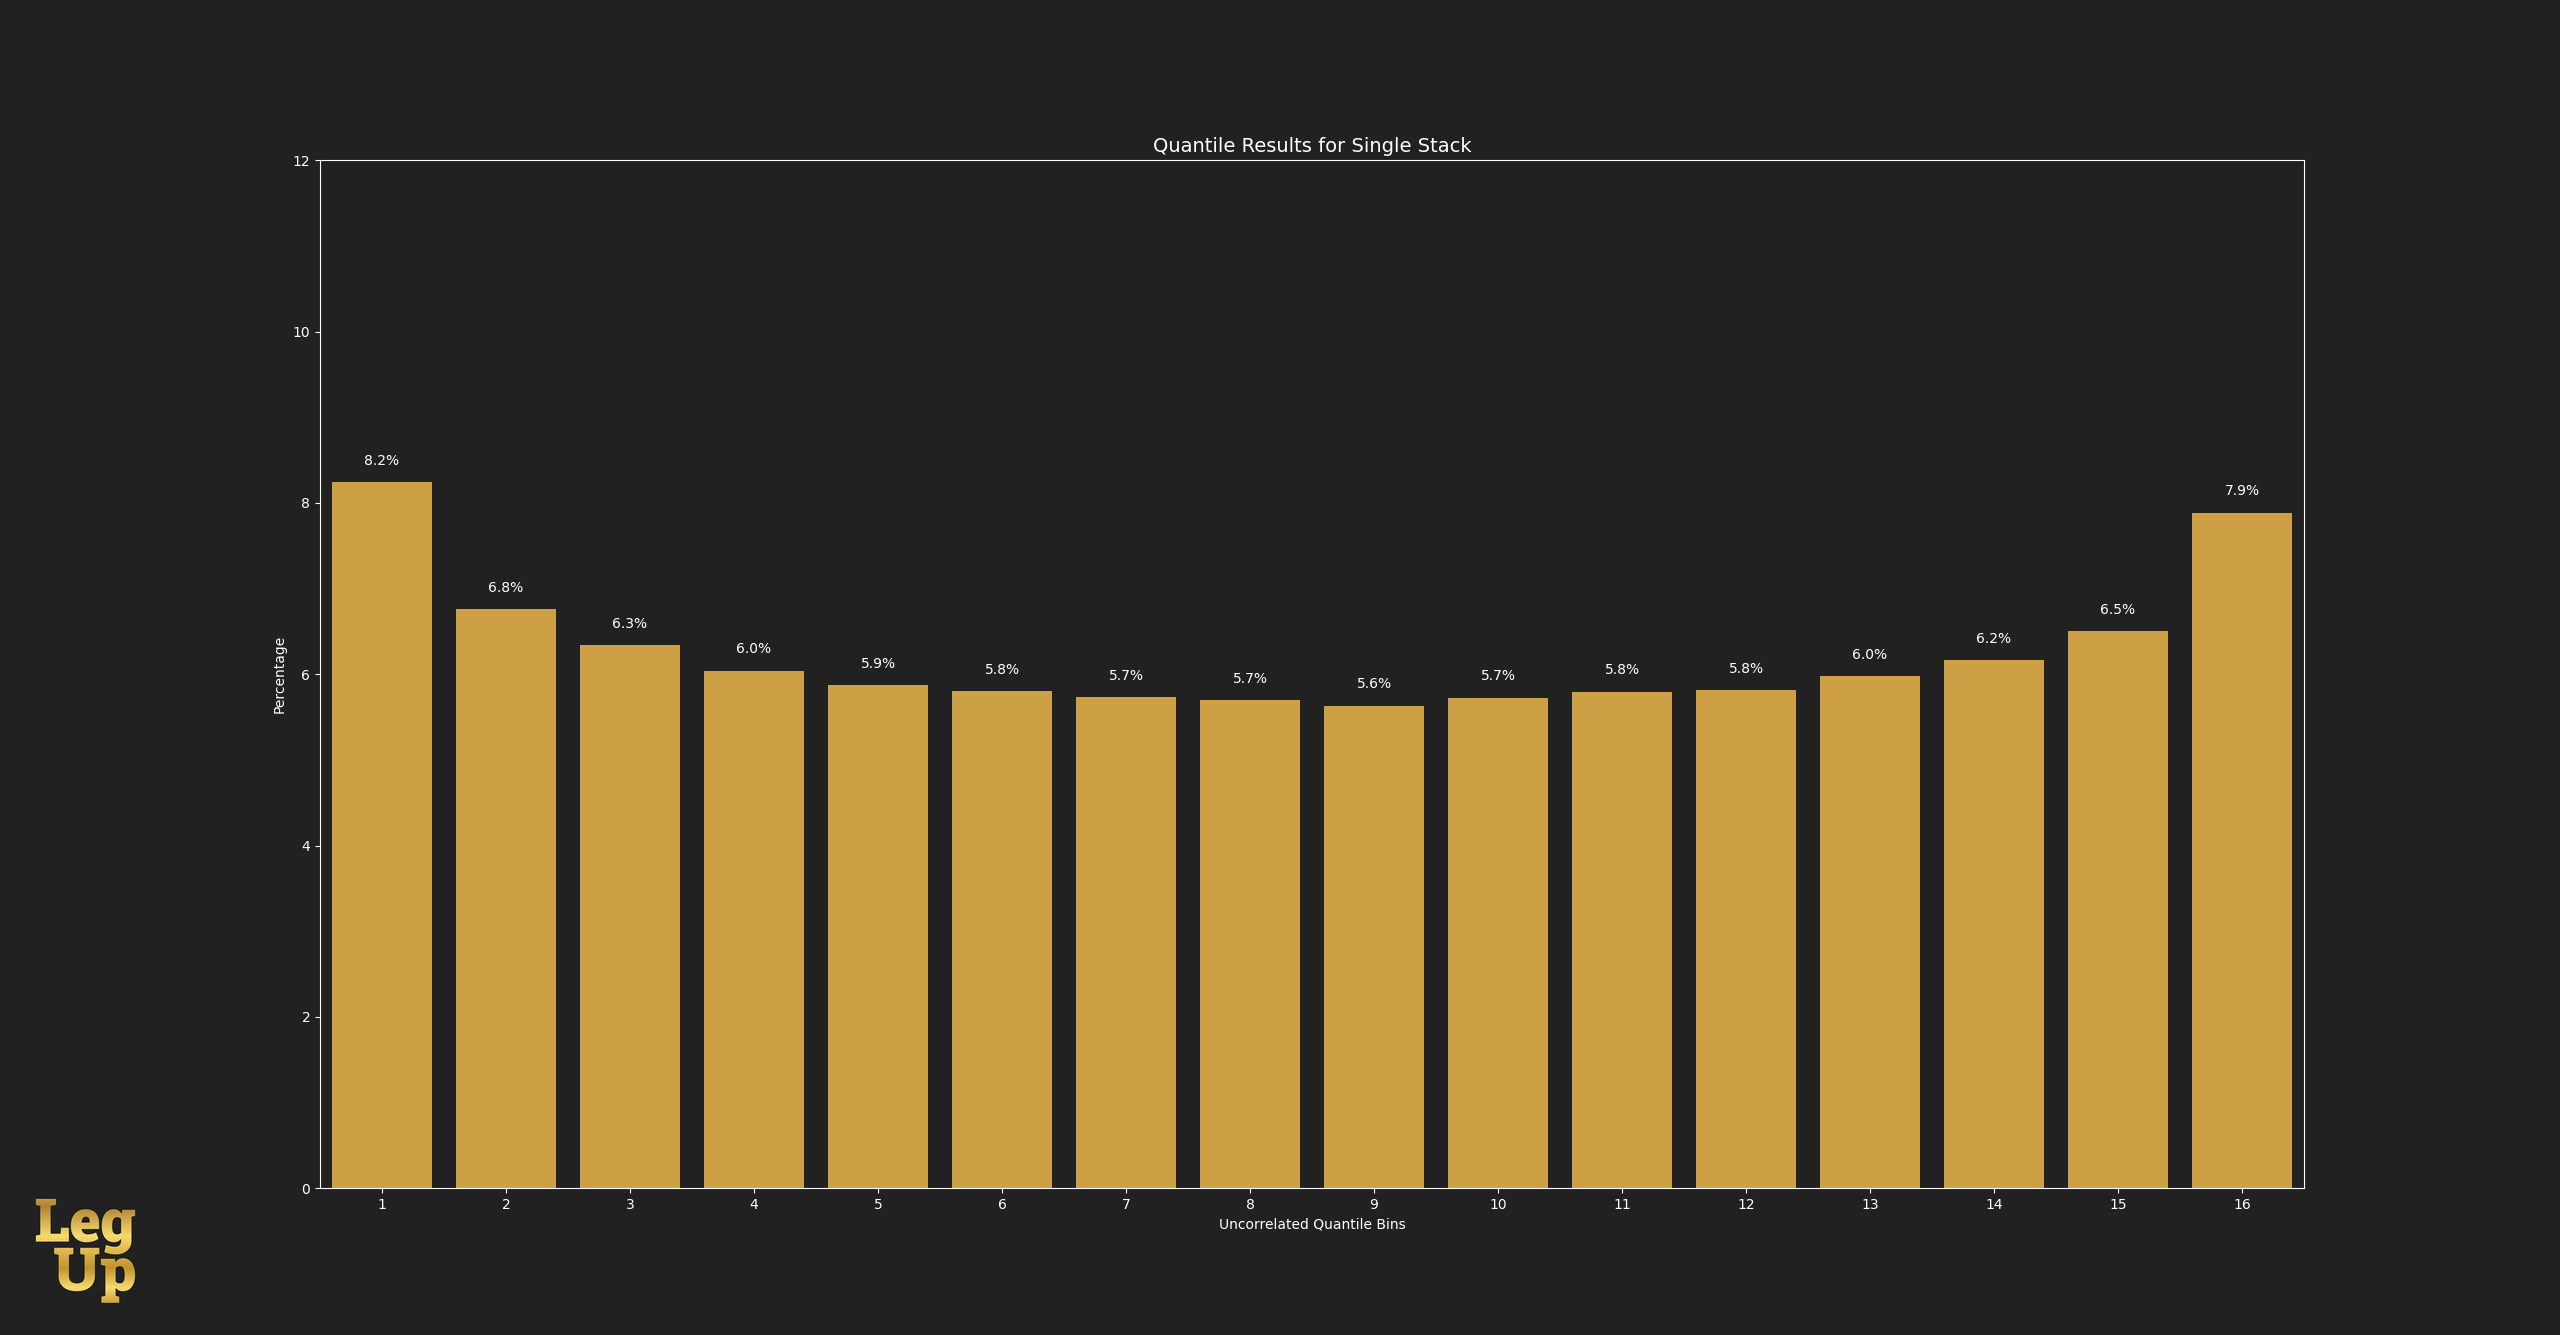
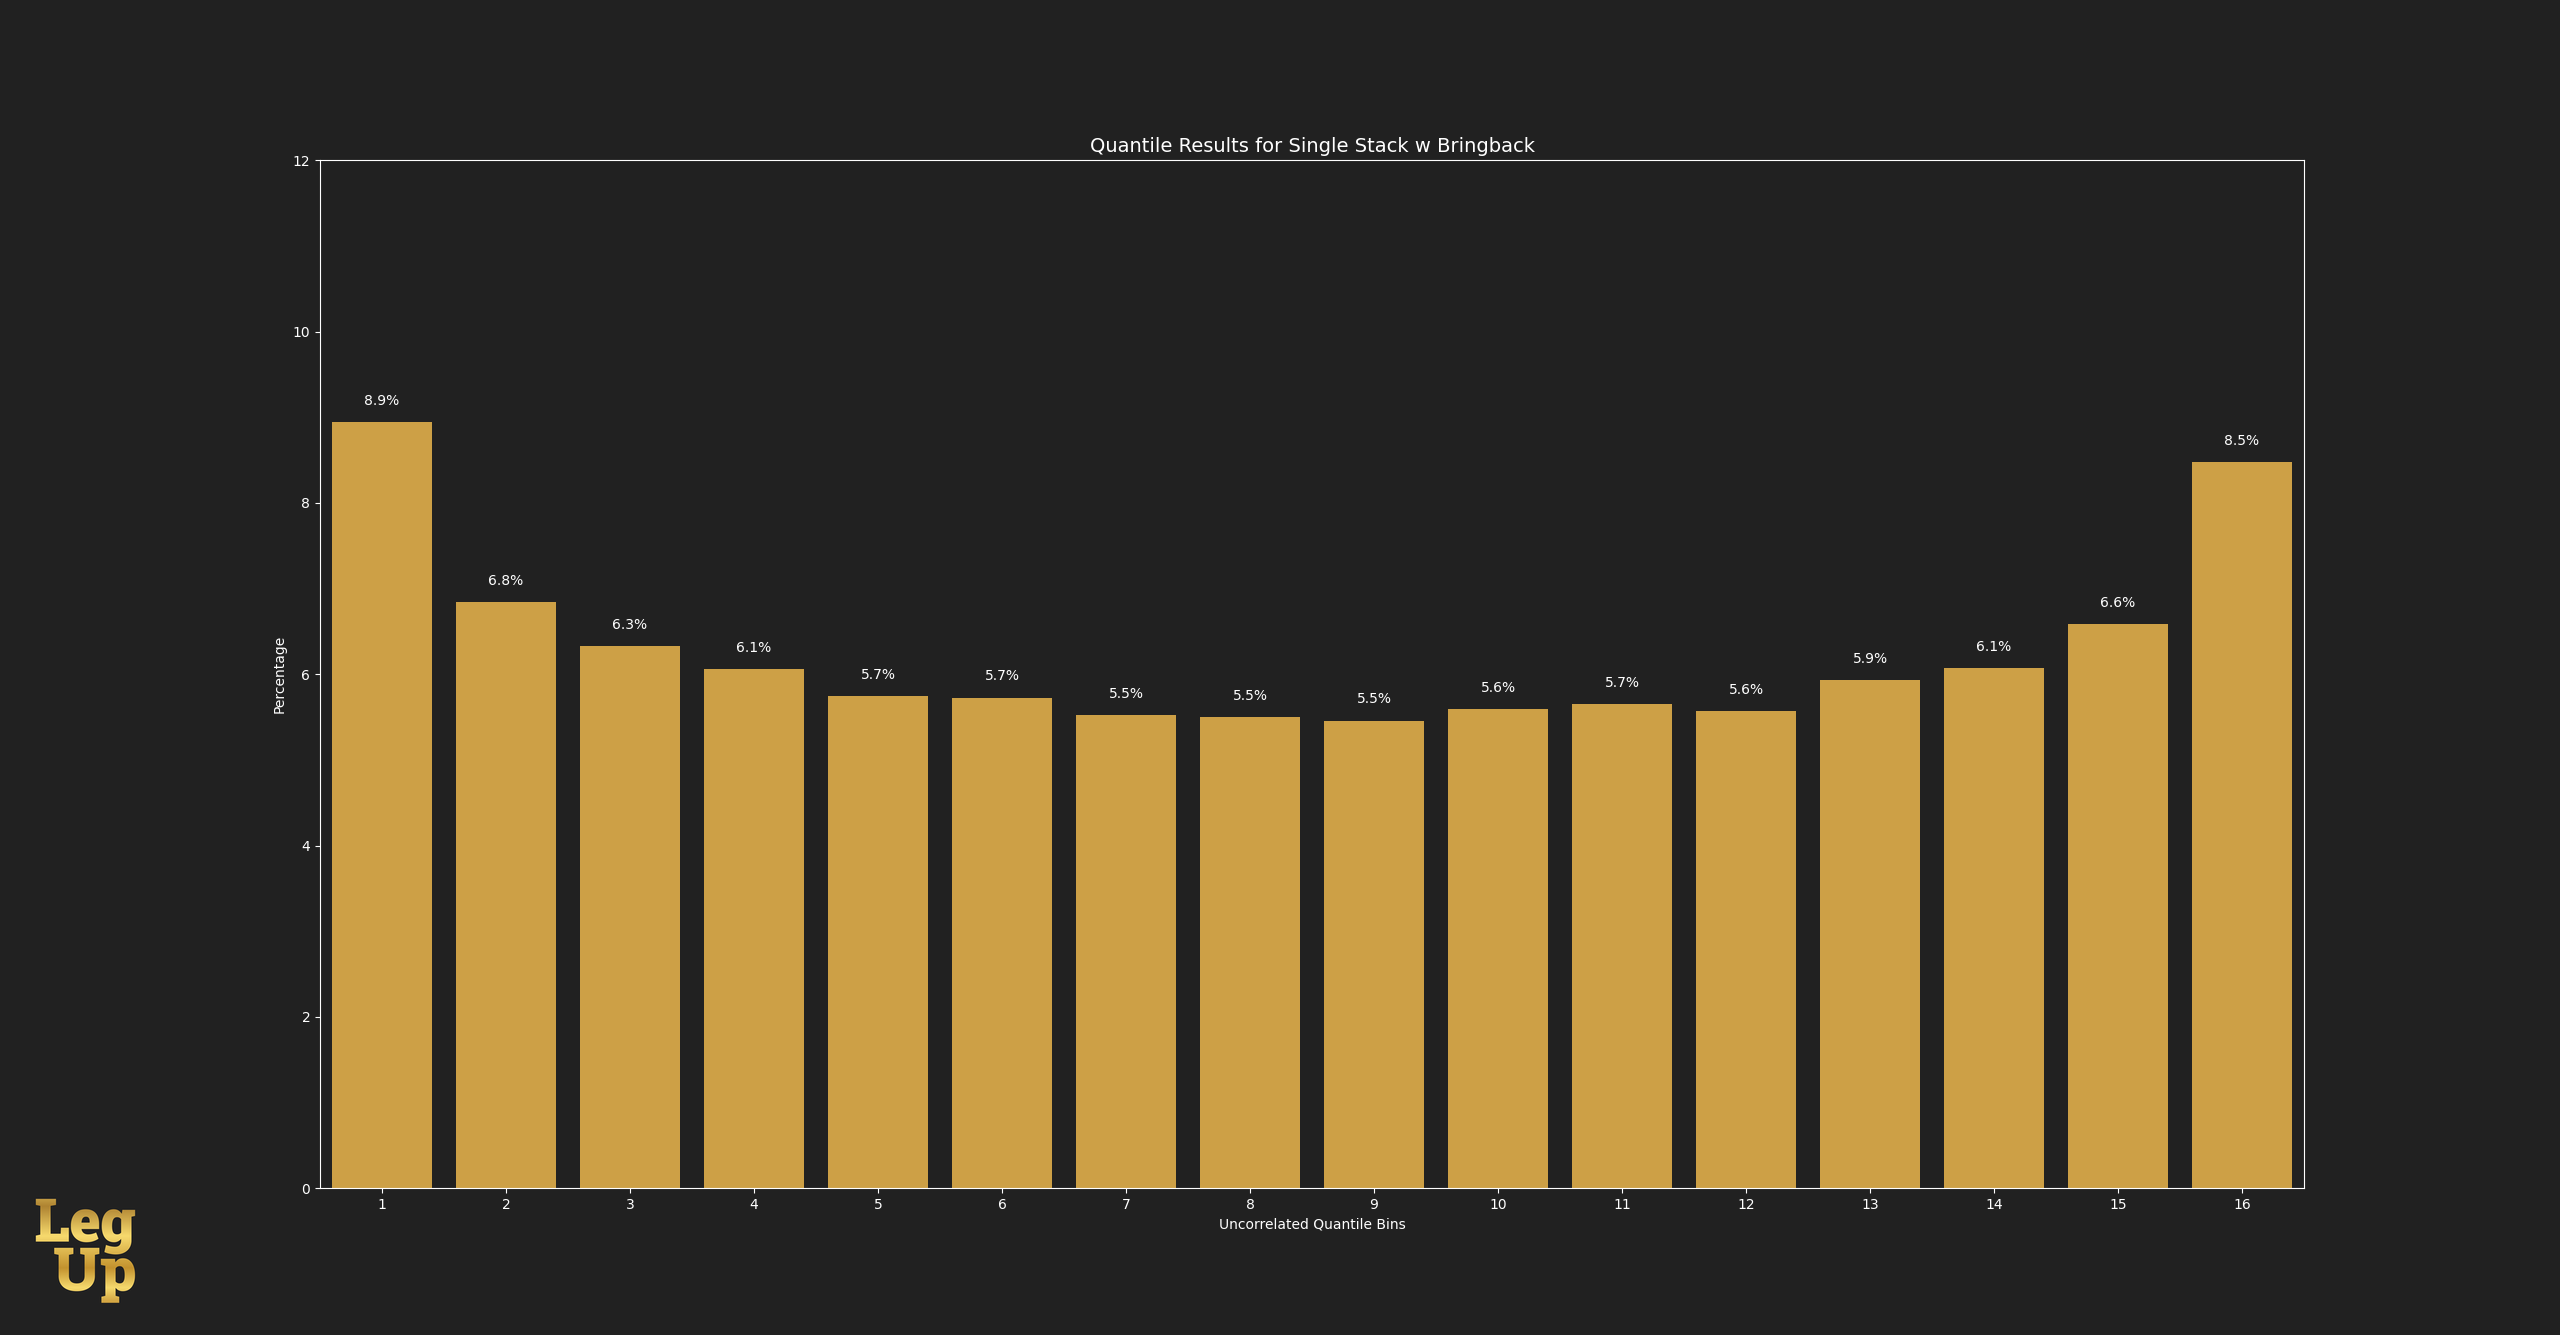
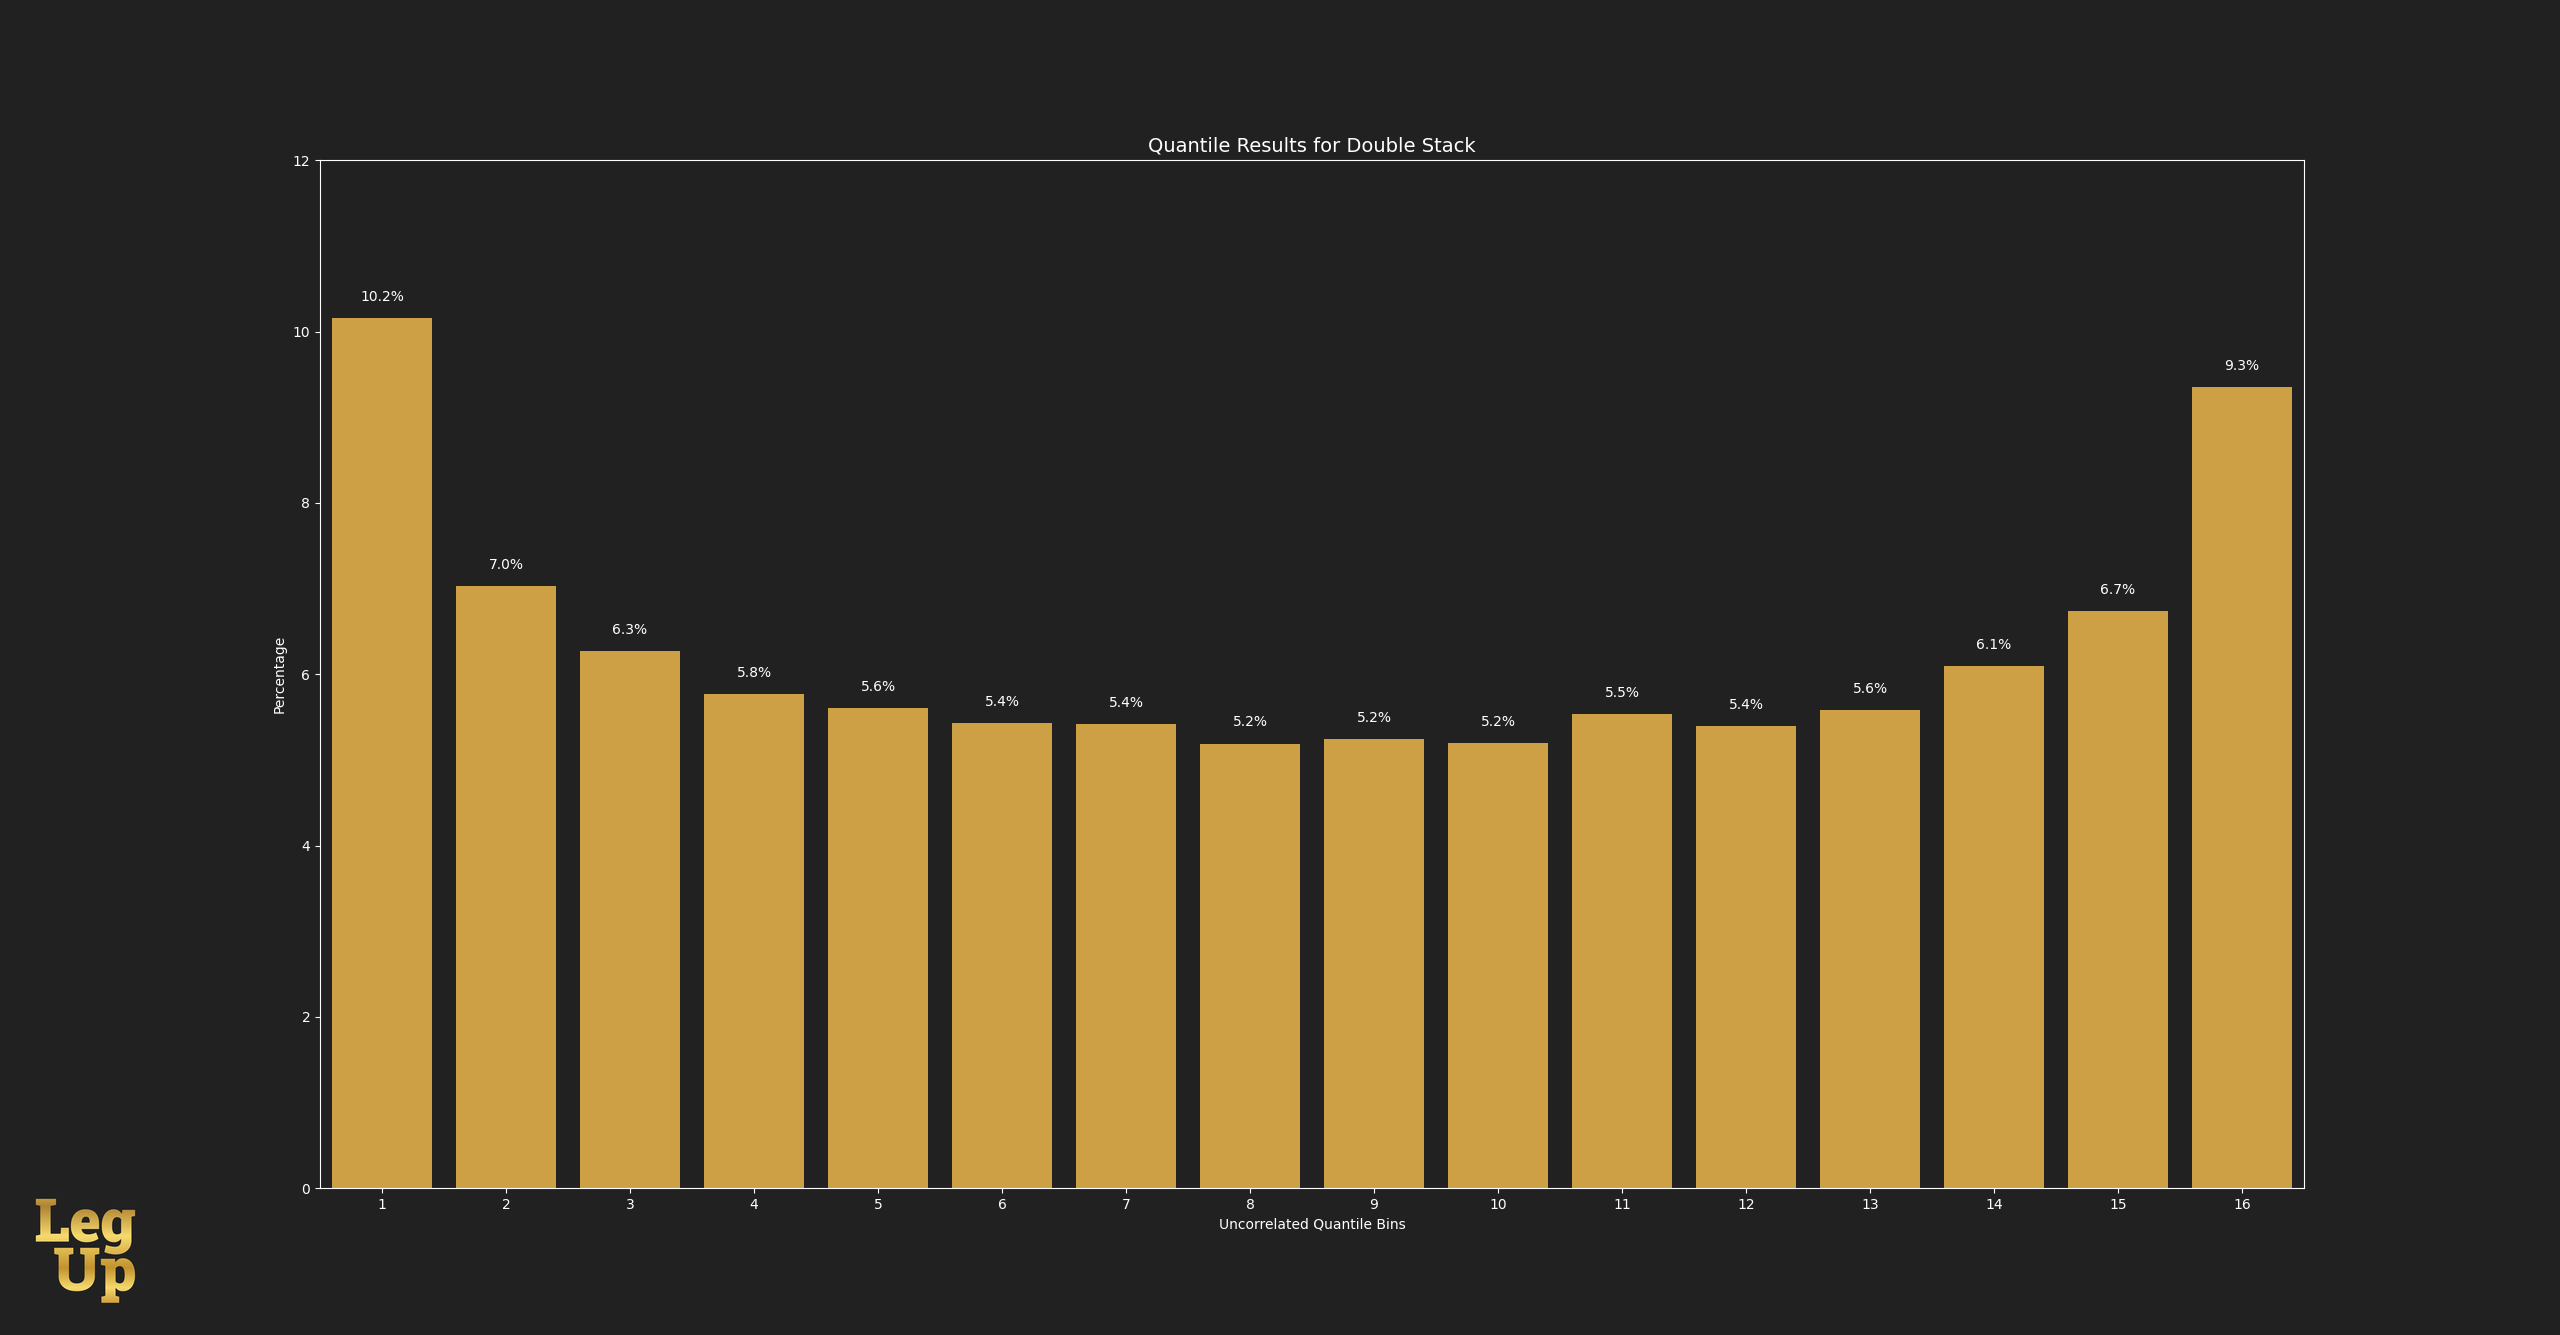
First, we'll examine some charts showing how different build classifications finished relative to the quantile buckets defined by the non-correlated builds.
Simply put, I divided the scores from the non-correlated teams into 16 buckets, so we could have a baseline to compare each classification to.
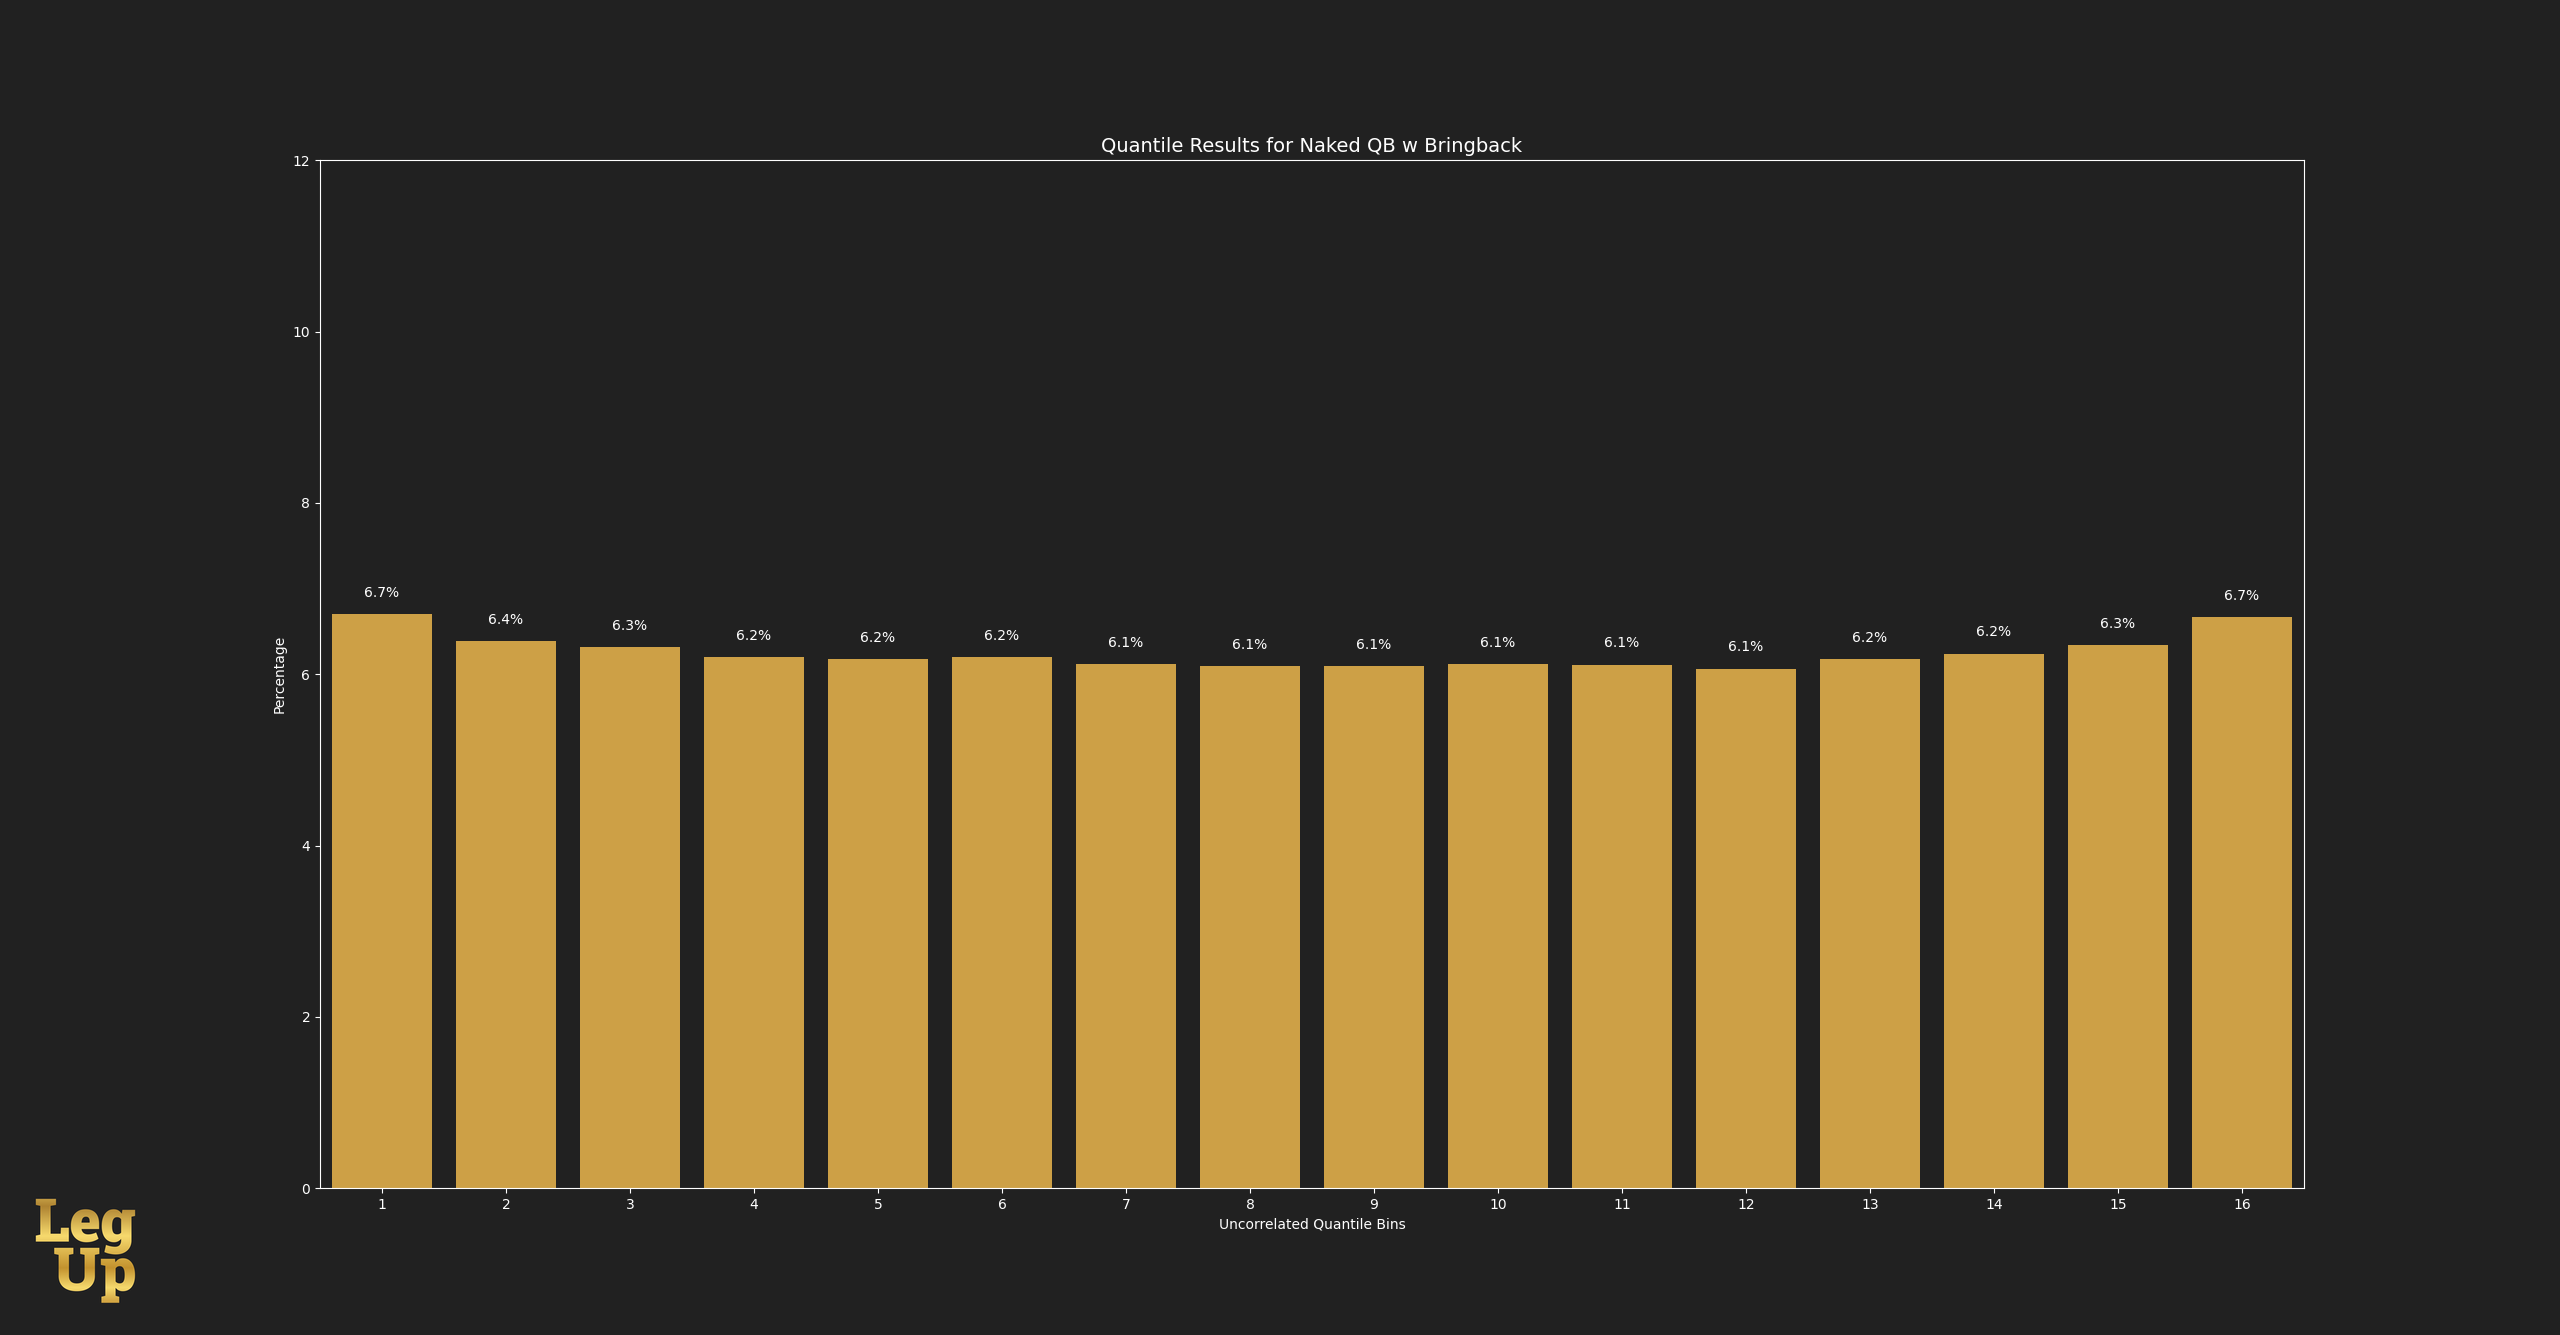
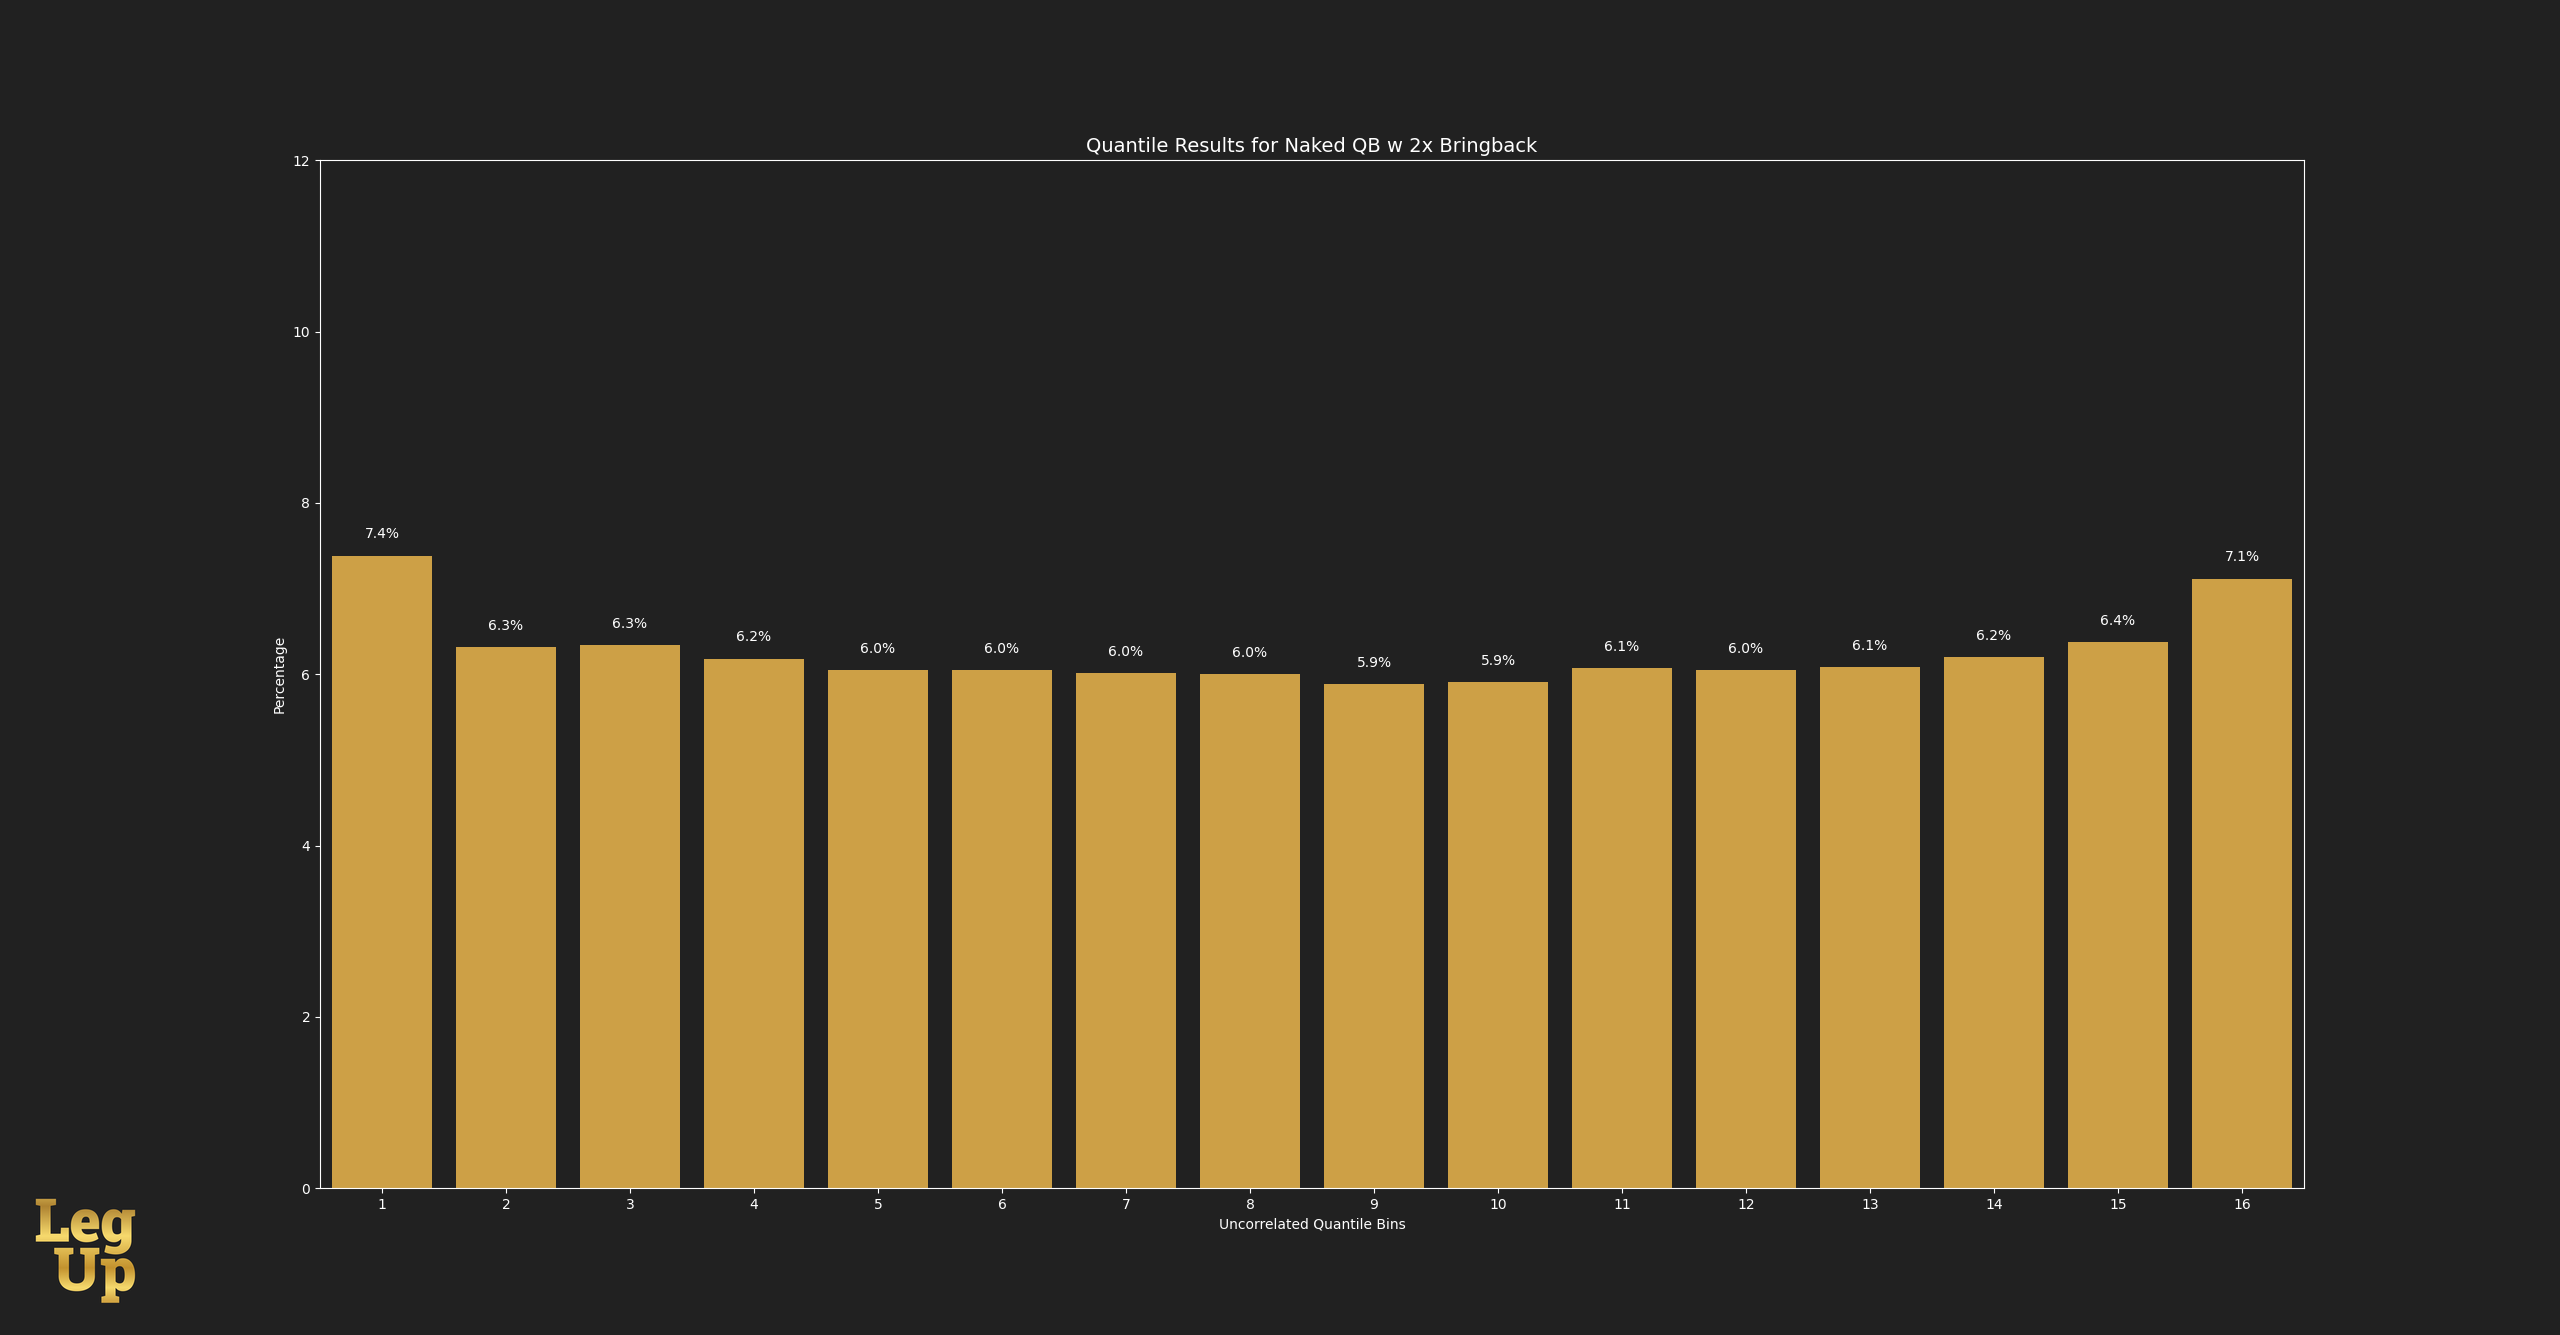
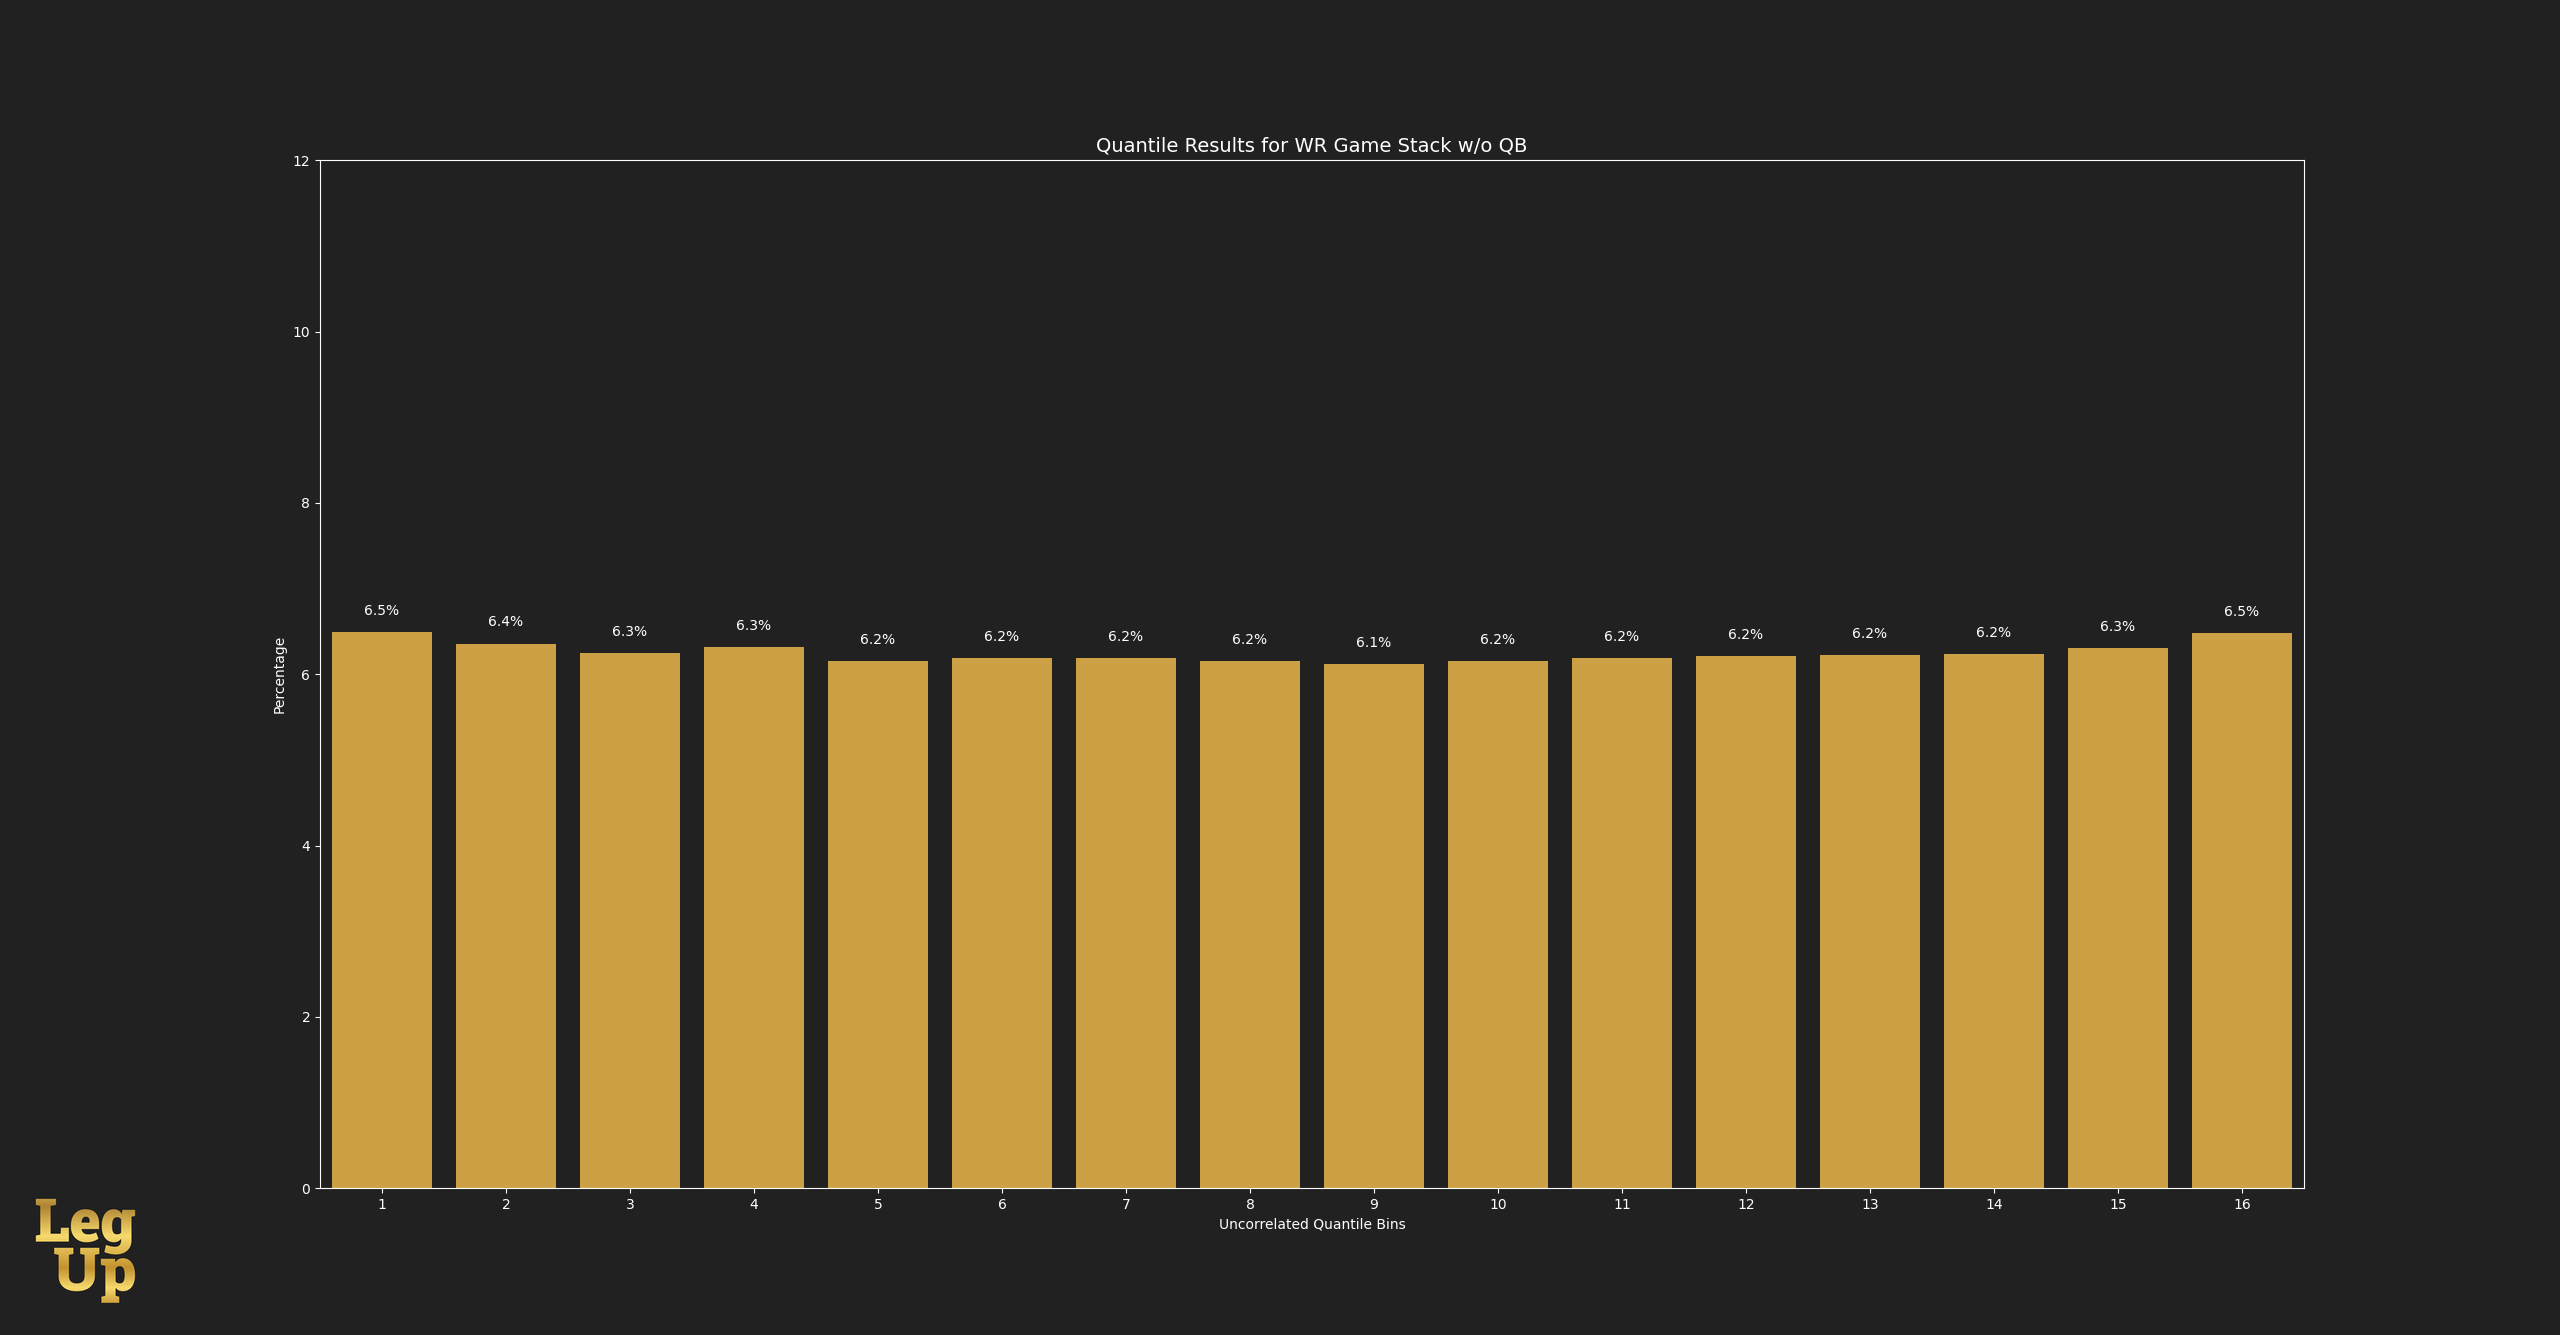
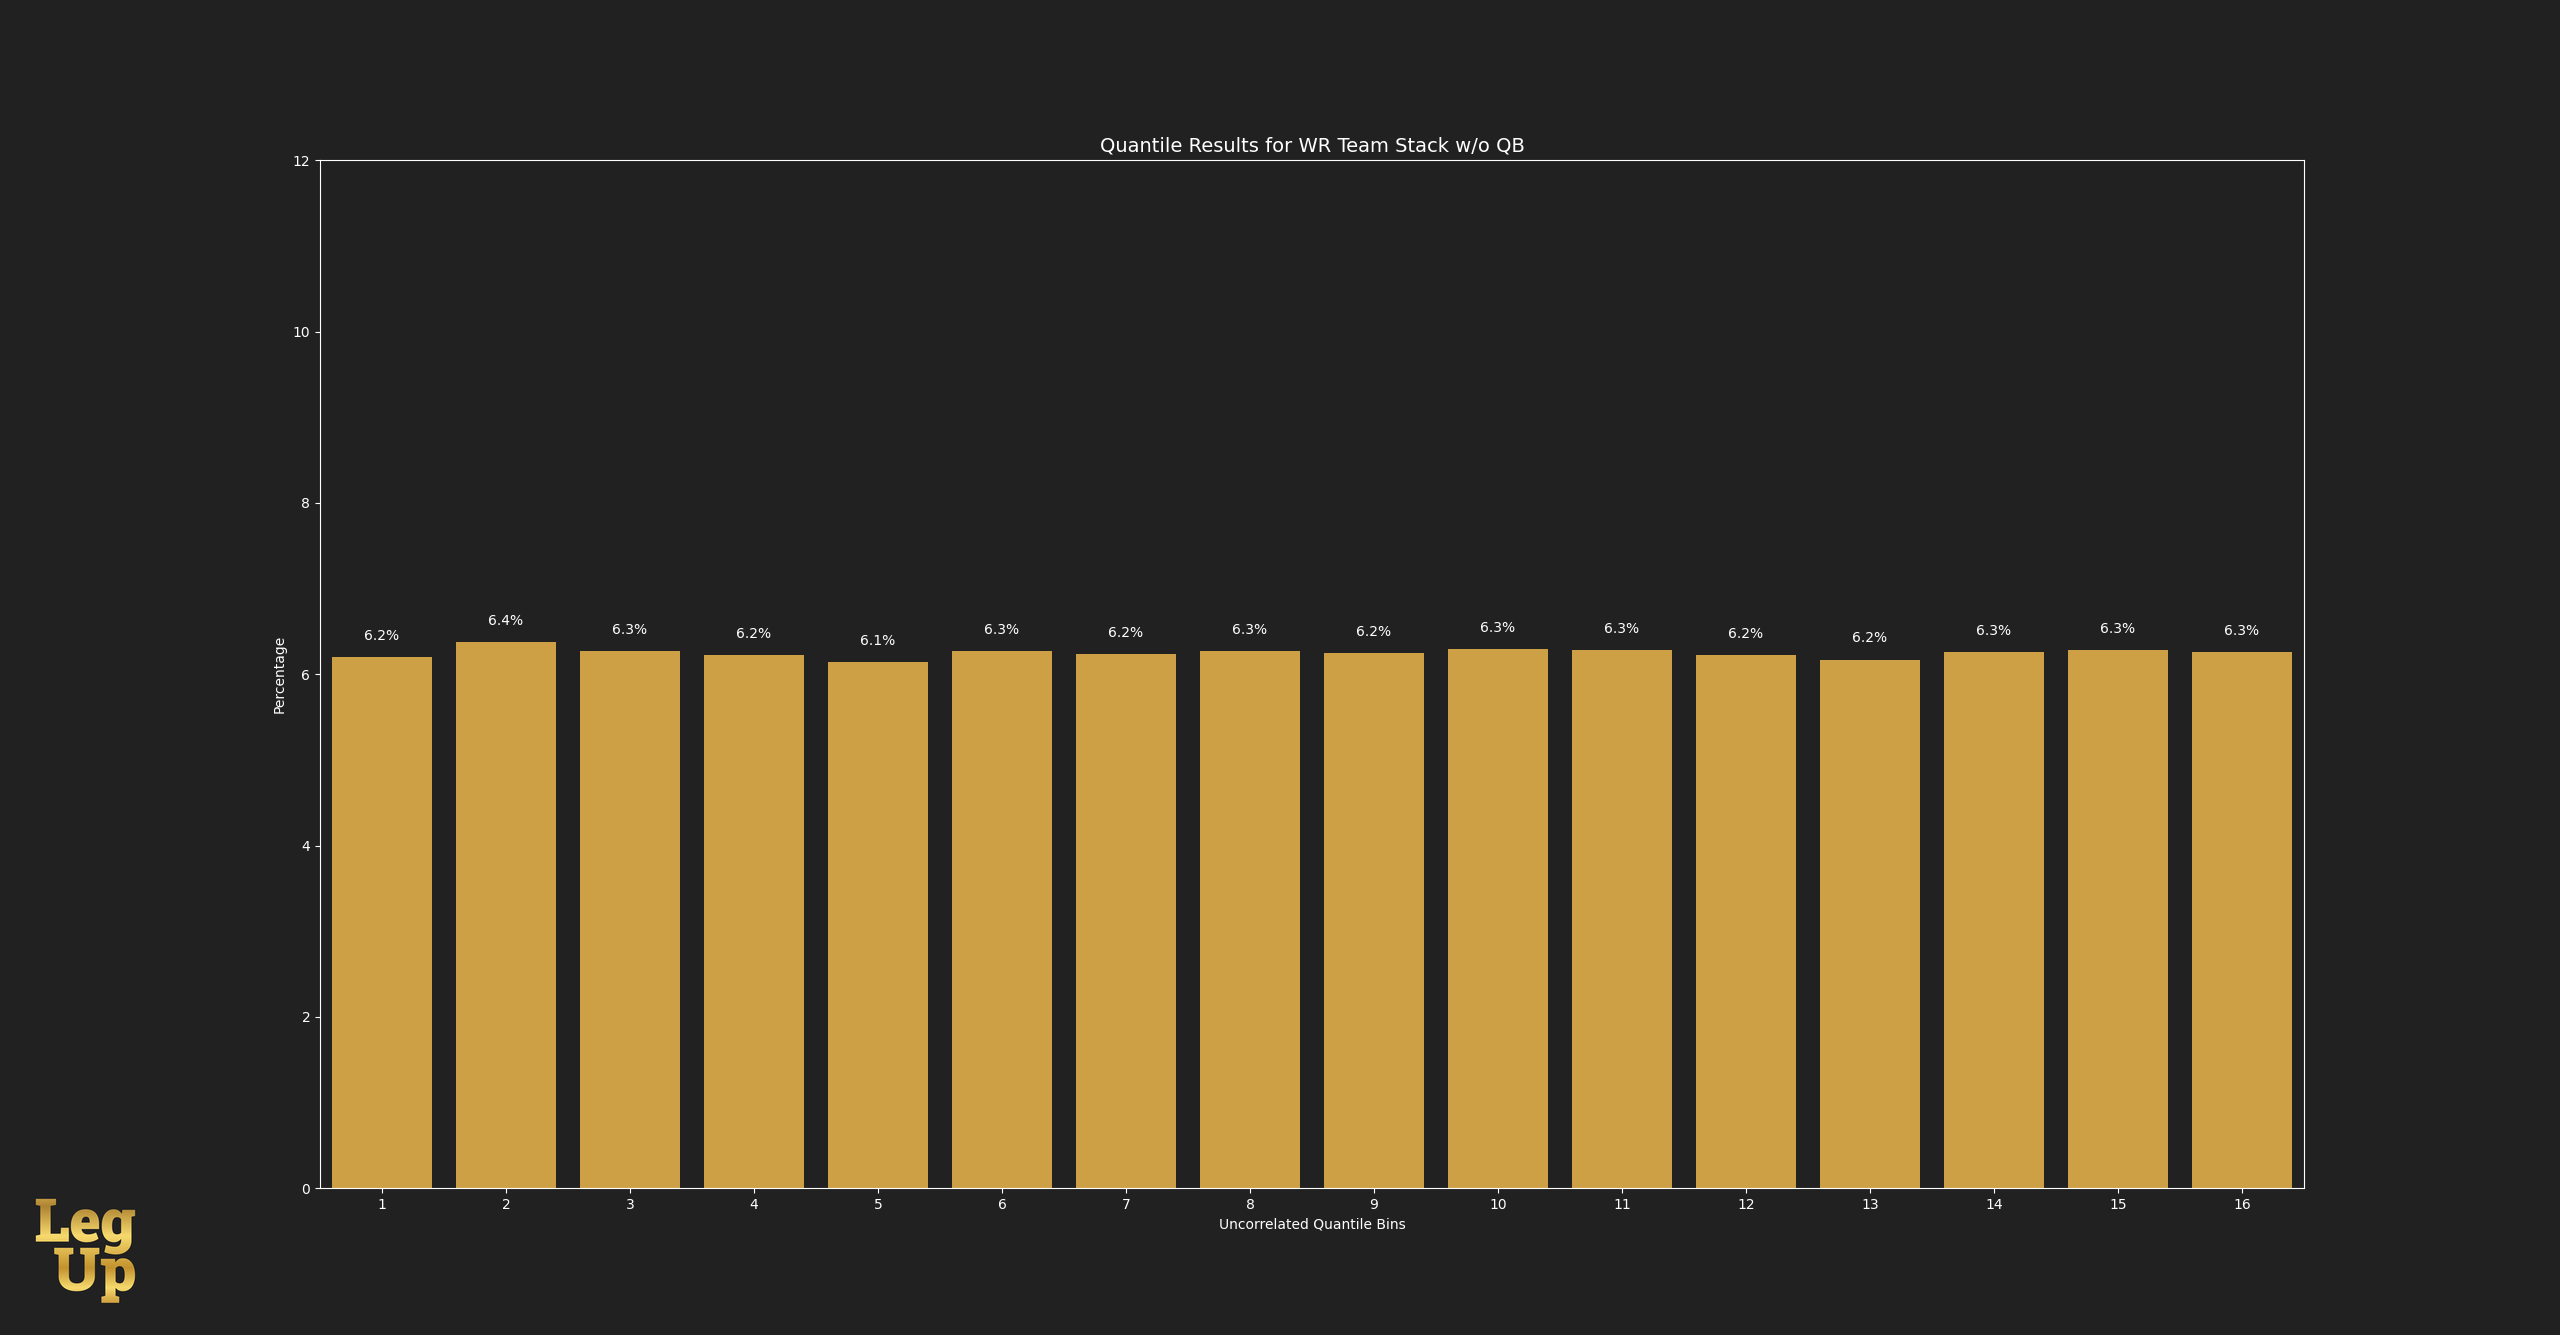
Finally, below is a summary chart that displays the rate at which each classification finished in the top quantile bucket (representing a score good enough to advance from Week 16 if competing against a pod of purely uncorrelated teams):
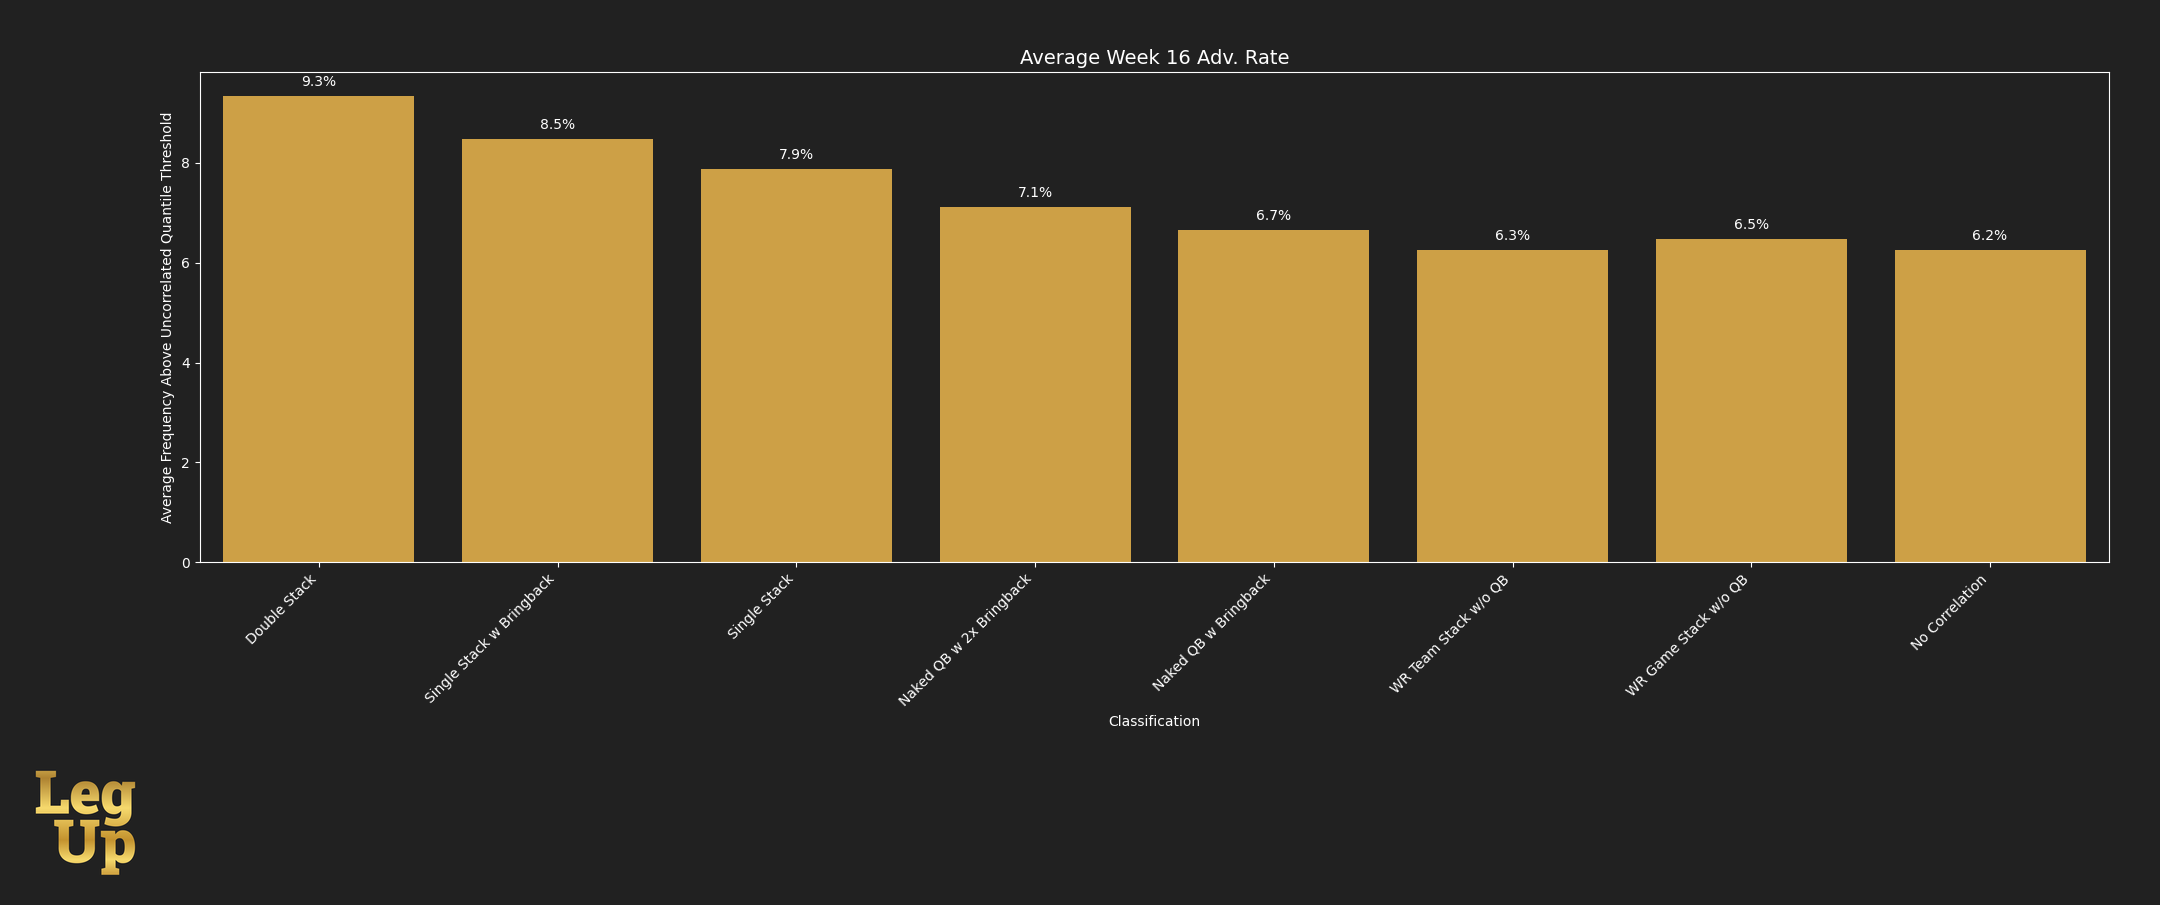
We can see that the "Double Stack" classification had the highest value added of any correlation, improving the base advance rate by 3.1% when compared to the "No Correlation" classification. This represents a 50% increase from the base advance rate.
"Single Stack" saw a 1.7% improvement, a 27.4% increase from the base advance rate.
"Single Stack w Bringback" saw a 2.3% improvement, a 37% increase from the base advance rate.
We can extricate the value of a bringback by comparing "Single Stack" and "Single Stack w Bringback," which shows a bringback adds approximately a 10% increase of the base advance rate in a vacuum.
That's valuable information, but now we need to compare the impact each of these correlations has on our expected value in Weeks 16 and 17.
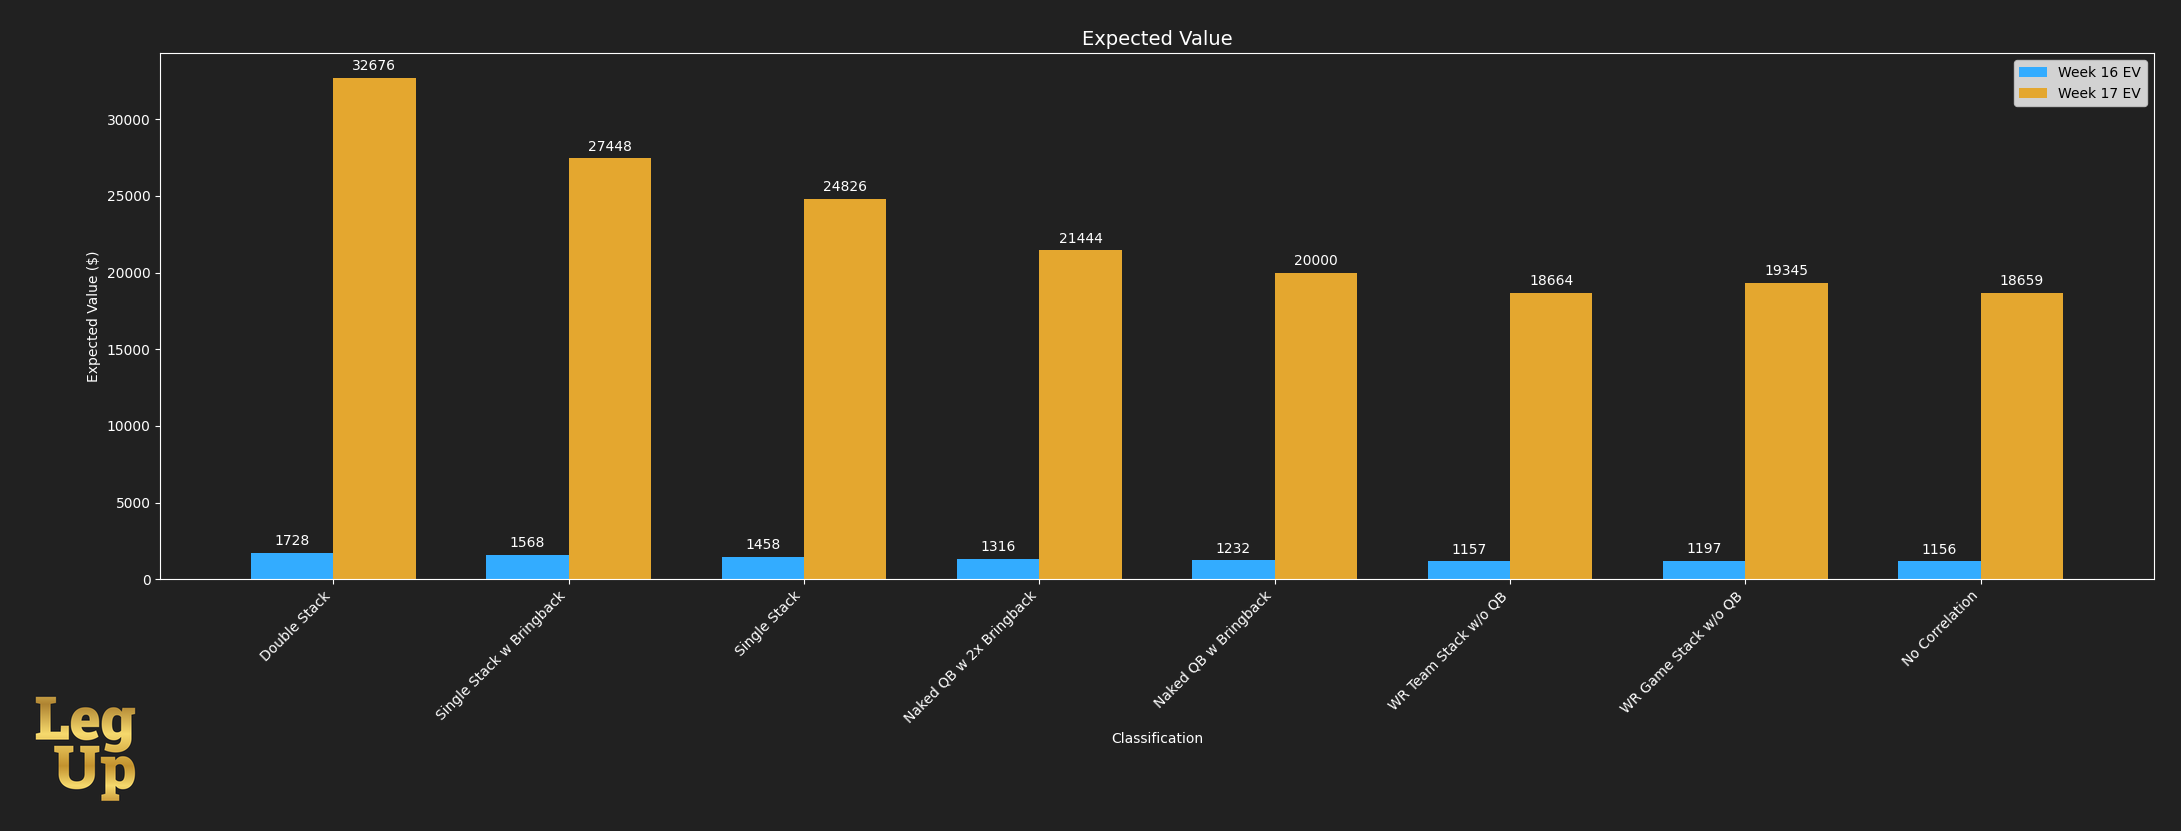
It's not fair to just look at the Week 17 EV numbers and say, "number bigger; therefore, only stack Week 17."
After all, our neutral advance rate from Week 16 to Week 17 is only 1/16.
So to compare apples to apples, we can divide the Week 17 EV numbers by 16.

We can see that across the board, all types of correlation are more valuable from an EV perspective in Week 17 compared to Week 16.
This is due to the difference in prize structure from Week 16 to Week 17.
Week 16 prizes are rather binary, either you advance to week 17, or you don't. Sure, you get a small pay bump for finishing 2nd-5th in Week 16, but it's peanuts compared to the EV of a Week 17 finals seat.
Week 17 prize structure rewards you much more for capturing those top percentile outcomes. With Week 16, the reward is the same, regardless of if you finished in the 95th percentile or the 99th percentile.
It's also clear that the majority of the value from game stacking comes from the primary team stack. This isn't to say we shouldn't be game stacking, just that it's worth less than a team stack and we should be cognizant of this when we are adjusting player valuations when making draft decisions.
What we found when calibrating the Sidekick was that the amount we'd need to boost players for a Week 16 game stack correlation was so small relative to Week 17 game stack correlation that it was almost negligible.
Don't hear what I'm not saying; you can still game stack for Week 16. You just shouldn't really pay much in the way of ranking value for it. Don't intentionally select Player B, who you have lower in your rankings than Player A, simply because Player B is part of a Week 16 game stack.
The levers that we have to impact how our teams score fantasy points can be summarized as follows:
- Team stacking - the most powerful lever, has the largest impact on win rate and EV in not only the playoff weeks but also during the regular season.
- Game stacking - a powerful lever for increasing our win rate and EV in the playoff weeks, but the majority of the impact from game stacking is actually coming from the team stack with the QB. The bringback is just icing on the cake.
How these levers affect our desired outcomes in weeks 16 and 17 can be summarized as follows:
- Week 16 - stacking teams with or without a bringback is helpful for our Week 16 EV; it's just less impactful than doing so for Week 17.
- Week 17 - stacking teams with or without a bringback is very helpful for our Week 17 EV. Just remember to prioritize team stacking over game stacking.
*Nerdy Footnote from the Week 16/17 comparison chart:
For those of you doing the math at home, you'll notice the "No Correlation" Week 17 EV value is slightly higher than the actual EV of a Week 17 team that has an equal probability of each finish position ($18,489.31, to be precise).
This is due to some variance in the sims, as I only ran 10,000. If I were to run an infinite number of sims, the value would normalize to $18,489.31. I know that was bothering some of you (it was bothering me).
